Institute of Formal and Applied Linguistics
Charles University, Czech Republic
Faculty of Mathematics and Physics
Introduction to Machine Learning with Python – Winter 2025/26
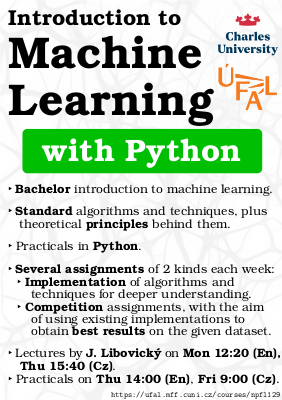
Machine learning is reaching notable success when solving complex tasks in many fields. This course serves as an introduction to basic machine learning concepts and techniques, focusing both on the theoretical foundation, and on implementation and utilization of machine learning algorithms in Python programming language. High attention is paid to the ability of application of the machine learning techniques on practical tasks, in which the students try to devise a solution with highest performance.
Python programming skills are required, together with basic probability theory knowledge.
About
Official name: Introduction to Machine Learning with Python
SIS code: NPFL129
Semester: winter
E-credits: 5
Examination: 2/2 C+Ex
Instructors: Jindřich Libovický (lecture),
Jan Bronec,
Tomáš Musil,
Kristýna Onderková,
Dušan Variš ,
Gianluca Vico (practicals),
Milan Straka (assignments & ReCodEx),
Jakub Klesa, Tymur Kotkov, Tymofii Shchetilin (teaching assistants)
This course is also part of the inter-university programme prg.ai Minor. It pools the best of AI education in Prague to provide students with a deeper and broader insight into the field of artificial intelligence. More information is available at prg.ai/minor.
Timespace Coordinates
- lecture: English lecture is held on Monday 12:20 in S3, Czech lecture on Thursday 15:40 in S3; first lecture is on Sep 29
- practicals: English practicals are held on Thursday 14:00 in S3, Czech practicals on Friday 9:00 in S3; first practicals are on Oct 02
All lectures and practicals will be recorded and available on this website.
Course Objectives
After this course students should…
- Be able to reason about task/problems suitable for ML
- Know when to use classification, regression and clustering
- Be able to choose from this method Linear and Logistic Regression, Multilayer Perceptron, Nearest Neighbors, Naive Bayes, Gradient Boosted Decision Trees, -means clustering
- Think about learning as (mostly probabilistic) optimization on training data
- Know how the ML methods learn including theoretical explanation
- Know how to properly evaluate ML
- Think about generalization (and avoiding overfitting)
- Be able to choose a suitable evaluation metric
- Responsibly decide what model is better
- Be able to implement ML algorithms on a conceptual level
- Be able to use Scikit-learn to solve ML problems in Python
Lectures
1. Introduction to Machine Learning Slides PDF Slides CS Lecture EN Lecture CS Practicals EN Practicals linear_regression_manual linear_regression_features Questions
2. Linear Regression, SGD Slides PDF Slides CS Lecture EN Lecture CS Practicals EN Practicals linear_regression_l2 linear_regression_sgd feature_engineering rental_competition Questions
3. Peceptron, Logistic Regression Slides PDF Slides CS Lecture EN Lecture perceptron logistic_regression_sgd grid_search thyroid_competition Questions
4. Multiclass Logistic Regression, Multilayer Perceptron Slides PDF Slides CS Lecture EN Lecture CS Practicals EN Practicals softmax_classification_sgd mlp_classification_sgd mnist_competition Questions
5. MLP, Softmax as MaxEnt classifier, F1 score Slides PDF Slides CS Lecture EN Lecture CS Practicals EN Practicals multilabel_classification_sgd diacritization Questions
6. Representing Text (TF-IDF, Word2Vec) Slides PDF Slides CS Lecture EN Lecture EN Practicals tf_idf imdb_sentiment diacritization_dictionary Questions
7. K Nearest Neighbors, Naive Bayes Slides PDF Slides CS Lecture EN Lecture CS Practicals EN Practicals k_nearest_neighbors naive_bayes isnt_it_ironic Questions
8. Correlation, Model Combination Slides PDF Slides CS Lecture EN Lecture 24/25 metric_correlation Questions
9. Decision Trees, Random Forests Slides PDF Slides CS Lecture EN Lecture EN Practicals decision_tree random_forest miniaturization Questions
10. Gradient Boosted Decision Trees Slides PDF Slides CS 24/25 EN Lecture CS Practicals EN Practicals gradient_boosting human_activity_recognition Questions
11. SVD, PCA, k-means Slides PDF Slides CS 24/25 EN Lecture CS Practicals EN Practicals pca kmeans nli_competition Questions
12. Statistical Hypothesis Testing, Model Comparison Slides PDF Slides CS Lecture EN Lecture bootstrap_resampling permutation_test Questions
13. Machine Learning Ethics, Final Summary Slides PDF Slides CS Lecture EN Lecture Questions
License
Unless otherwise stated, teaching materials for this course are available under CC BY-SA 4.0.
The lecture content, including references to some additional study materials. The main study material is the Pattern Recognition and Machine Learning by Christopher Bishop, referred to as PRML.
Note that the topics in italics are not required for the exam.
1. Introduction to Machine Learning
Sep 29, Oct 4 Slides PDF Slides CS Lecture EN Lecture CS Practicals EN Practicals linear_regression_manual linear_regression_features Questions
Learning objectives. After the lecture you should be able to…
- Explain to a non-expert what machine learning is.
- Explain the difference between classification and regression.
- Implement a simple linear-algebra-based algorithm for training linear regression.
Covered topics and where to find more:
- Introduction to machine learning
- Basic definitions [Sections 1 and 1.1 of PRML]
- Linear regression model [Section 3.1 of PRML]
After the lecture: short and non-comprehensive recap quiz.
2. Linear Regression, SGD
Oct 6, Oct 9 Slides PDF Slides CS Lecture EN Lecture CS Practicals EN Practicals linear_regression_l2 linear_regression_sgd feature_engineering rental_competition Questions
Learning objectives. After the lecture you should be able to
- Reason about overfitting in terms of model capacity.
- Use -regularization to control model capacity.
- Explain what the difference between parameters and hyperparameters is.
- Tell what the basic probability concepts are (joint, marginal, conditional probability; expected value, mean, variance).
- Mathematically describe and implement the stochastic gradient descent algorithm.
- Use both numerical and categorical features in linear regression.
Covered topics and where to find more:
- L2 regularization in linear regression [Section 1.1, 3.1.4 of PRML]
- Random variables and probability distributions [Section 1.2, 1.2.1 of PRML]
- Expectation and variance [Section 1.2.2 of PRML]
- Gradient descent [Section 5.2.4 of PRML]
- Stochastic gradient descent solution of linear regression
- Linear regression demo by Jared Willber
- Why Momentum Really Works by Gabriel Goh
- IPython notebook on momentum
After the lecture: short and non-comprehensive recap quiz.
3. Peceptron, Logistic Regression
Oct 13, Oct 16 Slides PDF Slides CS Lecture EN Lecture perceptron logistic_regression_sgd grid_search thyroid_competition Questions
Learning objectives. After the lecture you should be able to
- Think about binary classification using geometric intuition and use the perceptron algorithm.
- Define the main concepts of information theory (entropy, cross-entropy, KL-divergence) and prove their basic properties.
- Derive training objectives using the maximum likelihood principle.
- Implement and use logistic regression for binary classification with SGD.
Covered topics and where to find more:
- Linear models for classification [Section 4.1.1 of PRML]
- Perceptron algorithm [Section 4.1.7 of PRML]
- Probability distributions [Bernoulli Section 2.1, Categorical Section 2.2, Gaussian Section 2.3 of PRML]
- Information theory [Section 1.6 of PRML]
- Maximum likelihood estimation [Section 1.2.5 of PRML]
- Logistic regression [Section 4.3.2 of PRML]
- Cross-validation [Section 1.3 of PRML], covered in the practicals
- Logistic regression demo by Jared Willber
- Perceptron visualization by Vinícius Garcia
- IPython notebook on gradients and scaling and the interactive script
After the lecture: short and non-comprehensive recap quiz.
4. Multiclass Logistic Regression, Multilayer Perceptron
Oct 20, Oct 23 Slides PDF Slides CS Lecture EN Lecture CS Practicals EN Practicals softmax_classification_sgd mlp_classification_sgd mnist_competition Questions
Learning objectives. After the lecture you should be able to
- Implement muticlass classification with softmax.
- Reason about linear regression, logistic regression and softmax classification in a single probabilistic framework: with different target distributions, activation functions and training using maximum likelihood estimate.
- Explain multi-layer perceptron as a further generalization of linear models.
Covered topics and where to find more:
- Generalized linear models
- MSE as MLE [Section 3.1.1 of PRML]
- Multiclass logistic regression [Section 4.3.4 of PRML]
- Multilayer perceptron (neural network) [Sections 5-5.3 of PRML]
- Interactive demo of MLP by Andrej Karpathy
- Universal approximation theorem
After the lecture: short and non-comprehensive recap quiz.
5. MLP, Softmax as MaxEnt classifier, F1 score
Oct 27, Oct 30 Slides PDF Slides CS Lecture EN Lecture CS Practicals EN Practicals multilabel_classification_sgd diacritization Questions
Learning objectives. After the lecture you should be able to
- Implement training of multi-layer perceptron using SGD.
- Explain the theoretical foundation behind the softmax activation function (including the necessary math).
- Choose a suitable evaluation metric for various classification tasks.
Covered topics and where to find more:
- Lagrange multipliers [Appendix E of PRML]
- A Simple Explanation of Why Lagrange Multipliers Works, a blog post by Andrew Chamberlain
- Derivation of softmax via the maximum entropy principle [The equivalence of logistic regression and maximum entropy models writeup]
- score and score
- IPython notebook on micro and macro F1-score
After the lecture: short and non-comprehensive recap quiz.
6. Representing Text (TF-IDF, Word2Vec)
Nov 3, Nov 6 Slides PDF Slides CS Lecture EN Lecture EN Practicals tf_idf imdb_sentiment diacritization_dictionary Questions
Learning objectives. After the lecture you should be able to
- Use TF-IDF for representing documents and explain its information-theoretical interpretation.
- Explain training of Word2Vec as a special case of logistic regression.
- Use pre-trained word embeddings for simple NLP tasks.
Covered topics and where to find more:
- Accuracy and F-score in NLP
- TF-IDF
- Word2Vec (original paper Mikolov et al., 2013)
- IPython notebook from the practicals
After the lecture: short and non-comprehensive recap quiz.
7. K Nearest Neighbors, Naive Bayes
Nov 10, Nov 13 Slides PDF Slides CS Lecture EN Lecture CS Practicals EN Practicals k_nearest_neighbors naive_bayes isnt_it_ironic Questions
Learning objectives. After the lecture you should be able to
- Implement and use -nearest neighbors for classification and regression.
- Explain the very basic principles of Bayesian thinking.
- Implement and use Naive Bayes Classifier.
Covered topics and where to find more:
- K-nearest neighbors [Section 2.5.2 of PRML]
- Naive Bayes classifier [Basic idea in Section 8.2.2 of PRML]
After the lecture: short and non-comprehensive recap quiz.
8. Correlation, Model Combination
Nov 21 Slides PDF Slides CS Lecture EN Lecture 24/25 metric_correlation Questions
Learning objectives. After the lecture you should be able to
-
Explain and implement different ways of measuring correlation: Pearson's correlation, Spearman's correlation, Kendall's .
-
Decide if correlation is a good metric for your model.
-
Measure inter-annotator agreement and draw conclusions for data cleaning and for limits of your models.
-
Use correlation with human judgment to validate evaluation metrics.
Covered topics and where to find more:
- Covariance and correlation
- Inter-annotator agreement
After the lecture: short and non-comprehensive recap quiz.
9. Decision Trees, Random Forests
Nov 24, Nov 27 Slides PDF Slides CS Lecture EN Lecture EN Practicals decision_tree random_forest miniaturization Questions
Learning objectives. After the lecture you should be able to
-
Ensemble models with uncorrelated predictions.
-
Distill ensembles into smaller models.
-
Implement Decision Trees and Random Forests for classification and regression
-
Explain how the splitting criterion depend on optimized loss function
-
Tell how Random Forests differ from Gradient Boosted Decision Trees
Covered topics and where to find more:
-
Model ensembling [Section 14.2 of PRML]
-
Decision trees [Section 14.4 of PRML]
- Decision trees demo by Jared Wilber & Lucía Santamaría
-
Random forests
- Random forests demo by Jenny Yeon & Jared Wilber
Recording of the Czech lecture failed, please use the English recording instead. Assignments for the 9th lecture were discussed jointly with the assignments from the 8th lecture and discussed in the video from the previous practicals.
After the lecture: short and non-comprehensive recap quiz.
10. Gradient Boosted Decision Trees
Dec 1, Dec 4 Slides PDF Slides CS 24/25 EN Lecture CS Practicals EN Practicals gradient_boosting human_activity_recognition Questions
Learning objectives. After the lecture you should be able to
-
Explain second-order optimization methods
-
Implement gradient boosted decision trees for regression and classification
-
Decide what supervised machine learning approach is suitable for particular problems
Covered topics and where to find more:
-
Gradient boosting decision trees [Paper XGBoost: A Scalable Tree Boosting System]
- Interactive Playground by Alex Rogozhnikov
Practicals: Extra materials
- See the English practicals video from the 46th minute
- Histogram Gradient Boosting
- slides (see binning on the slide 22)
- Support Vector Machines (SVMs):
- 22/23 NPFL129 lectures #6 and #7
- MIT lecture
- Stanford CS229 lecture notes
After the lecture: short and non-comprehensive recap quiz.
11. SVD, PCA, k-means
Dec 8 Slides PDF Slides CS 24/25 EN Lecture CS Practicals EN Practicals pca kmeans nli_competition Questions
Learning objectives. After the lecture you should be able to
-
Theoretically explain Singular Value Decomposition (SVD), prove it exists and explain what the Eckart-Young theorem says.
-
Theoretically explain Principal Component Analysis (PCA) and say how it explains the variance in the data based on SVD.
-
Use SVD or PCA for dimensionality reduction, data visualization and data whitening.
-
Implement the -means algorithm and use it for clustering.
Covered topics and where to find more:
-
Singular value decomposition [Gilbert Strang: Linear Algebra and Learning from Data. Wellesley- Cambridge Press, 2019. Chapters I.8, I.9.]
- Lectures 4-7 in the corresponding course from MIT Courseware
-
Principal component analysis [Sections 12.1 and 12.4.2 of PRML]
-
Power iteration algorithm
-
K-Means clustering [Section 9.1 of PRML]
After the lecture: short and non-comprehensive recap quiz.
12. Statistical Hypothesis Testing, Model Comparison
Dec 15 Slides PDF Slides CS Lecture EN Lecture bootstrap_resampling permutation_test Questions
Learning objectives. After the lecture you should be able to
-
Explain foundations of statistical hypothesis testing.
-
Reason about multiple comparison problem.
-
Use Bootstrap Resampling and Permutation Tests to compare machine learning models.
Covered topics and where to find more:
- Statistical hypothesis testing
- Bootstrap resampling
- Paired bootstrap test
- Random permutation test
After the lecture: short and non-comprehensive recap quiz.
13. Machine Learning Ethics, Final Summary
Jan 05 Slides PDF Slides CS Lecture EN Lecture Questions
Learning objectives. After the lecture you should be able to
-
Explain what main theoretical ethical frameworks are.
-
Reason about ethical problems in various stages of developing ML System.
Covered topics and where to find more:
-
Main ethical frameworks: deontology, utilitarism
-
Ethical problem examples
-
Problem definition (some tasks are inherently problematic)
-
Data collection (biases, unethical acquisition)
-
Modeling problems (bias amplification via discretization, privacy violation via memorization)
-
Evaluation problems (misleading metrics, unexpected consequences of optimization)
-
Deployment (train-test mismatch, feedback loops)
-
-
More materials:
-
Rachel Thomas: 11 Short Machine Learning Ethics Videos
-
Mark Coeckelbergh: AI Ethics / Etika umělé inteligence
-
Requirements
To pass the practicals, you need to obtain at least 70 points, excluding the bonus points. Note that up to 40 points above 70 (both bonus and non-bonus) will be transfered to the exam. In total, assignments for at least 105 points (not including the bonus points) will be available.
Environment
The tasks are evaluated automatically using the ReCodEx Code Examiner.
The evaluation is performed using Python 3.11, scikit-learn 1.7.2, numpy 2.3.3, scipy 1.16.2, pandas 2.3.2, and matplotlib 3.10.6. You should install the exact version of these packages yourselves.
Teamwork
Solving assignments in teams (of size at most 3) is encouraged, but everyone has to participate (it is forbidden not to work on an assignment and then submit a solution created by other team members). All members of the team must submit in ReCodEx individually, but can have exactly the same sources/models/results. Each such solution must explicitly list all members of the team to allow plagiarism detection using this template.
No Cheating
Cheating is strictly prohibited and any student found cheating will be punished. The punishment can involve failing the whole course, or, in grave cases, being expelled from the faculty. While discussing assignments with any classmate is fine, each team must complete the assignments themselves, without using code they did not write (unless explicitly allowed). Of course, inside a team you are allowed to share code and submit identical solutions. Note that all students involved in cheating will be punished, so if you share your source code with a friend, both you and your friend will be punished. That also means that you should never publish your solutions.
linear_regression_manual
Deadline: Oct 15, 22:00 3 points
Starting with the linear_regression_manual.py template, solve a linear regression problem using the algorithm from the lecture which explicitly computes the matrix inversion. Then compute root mean square error on the test set.
Note that your results may be slightly different (because of varying floating point arithmetic on your CPU).
python3 linear_regression_manual.py --test_size=0.1
52.38
python3 linear_regression_manual.py --test_size=0.5
54.58
python3 linear_regression_manual.py --test_size=0.9
59.46
linear_regression_features
Deadline: Oct 15, 22:00 3 points
Starting with the
linear_regression_features.py
template, use scikit-learn to train a model of a 1D curve.
Try using a concatenation of features for from 1 to a given range, and report RMSE of every such configuration.
Note that your results may be slightly different (because of varying floating point arithmetic on your CPU).
python3 linear_regression_features.py --data_size=10 --test_size=5 --range=6
Maximum feature order 1: 0.74 RMSE
Maximum feature order 2: 1.87 RMSE
Maximum feature order 3: 0.53 RMSE
Maximum feature order 4: 4.52 RMSE
Maximum feature order 5: 1.70 RMSE
Maximum feature order 6: 2.82 RMSE
python3 linear_regression_features.py --data_size=30 --test_size=20 --range=9
Maximum feature order 1: 0.56 RMSE
Maximum feature order 2: 1.53 RMSE
Maximum feature order 3: 1.10 RMSE
Maximum feature order 4: 0.28 RMSE
Maximum feature order 5: 1.60 RMSE
Maximum feature order 6: 3.09 RMSE
Maximum feature order 7: 3.92 RMSE
Maximum feature order 8: 65.11 RMSE
Maximum feature order 9: 3886.97 RMSE
python3 linear_regression_features.py --data_size=50 --test_size=40 --range=9
Maximum feature order 1: 0.63 RMSE
Maximum feature order 2: 0.73 RMSE
Maximum feature order 3: 0.31 RMSE
Maximum feature order 4: 0.26 RMSE
Maximum feature order 5: 1.22 RMSE
Maximum feature order 6: 0.69 RMSE
Maximum feature order 7: 2.39 RMSE
Maximum feature order 8: 7.28 RMSE
Maximum feature order 9: 201.70 RMSE
linear_regression_l2
Deadline: Oct 22, 22:00 2 points
Starting with the linear_regression_l2.py
template, use scikit-learn to train L2-regularized linear regression models
and print the results of the best of them.
Note that your results may be slightly different (because of varying floating point arithmetic on your CPU).
python3 linear_regression_l2.py --test_size=0.15
0.49 52.11
python3 linear_regression_l2.py --test_size=0.80
0.10 53.53
linear_regression_sgd
Deadline: Oct 22, 22:00 4 points
Starting with the linear_regression_sgd.py, implement minibatch SGD for linear regression and compare the results to an explicit linear regression solver.
Note that your results may be slightly different (because of varying floating point arithmetic on your CPU).
python3 linear_regression_sgd.py --batch_size=10 --epochs=50 --learning_rate=0.01
Test RMSE: SGD 114.118, explicit 115.6
Learned weights: 6.864 6.907 -1.208 -2.252 -1.464 -13.323 13.909 4.883 -11.468 -0.229 37.803 -5.191 ...
python3 linear_regression_sgd.py --batch_size=10 --epochs=50 --learning_rate=0.1
Test RMSE: SGD 111.395, explicit 115.6
Learned weights: 11.559 12.428 -1.529 -2.236 -1.575 -8.868 18.842 3.882 -7.175 -1.373 38.918 -6.522 ...
python3 linear_regression_sgd.py --batch_size=10 --epochs=50 --learning_rate=0.001
Test RMSE: SGD 151.210, explicit 115.6
Learned weights: 1.885 -0.580 -0.386 0.389 -1.745 -6.994 6.787 3.019 -8.013 0.353 15.712 -3.322 ...
python3 linear_regression_sgd.py --batch_size=1 --epochs=50 --learning_rate=0.01
Test RMSE: SGD 111.395, explicit 115.6
Learned weights: 11.559 12.429 -1.529 -2.236 -1.574 -8.868 18.843 3.882 -7.174 -1.373 38.917 -6.522 ...
python3 linear_regression_sgd.py --batch_size=50 --epochs=50 --learning_rate=0.01
Test RMSE: SGD 136.015, explicit 115.6
Learned weights: 2.940 0.504 -0.555 0.143 -2.088 -10.664 9.146 4.607 -11.620 0.129 24.294 -4.089 ...
python3 linear_regression_sgd.py --batch_size=50 --epochs=500 --learning_rate=0.01
Test RMSE: SGD 111.914, explicit 115.6
Learned weights: 9.360 9.428 -1.333 -2.646 -1.379 -11.248 16.352 4.153 -9.041 -0.755 38.872 -5.881 ...
python3 linear_regression_sgd.py --batch_size=50 --epochs=500 --learning_rate=0.01 --l2=0.1
Test RMSE: SGD 113.521, explicit 115.6
Learned weights: 8.013 7.818 -1.227 -2.234 -1.491 -11.592 14.863 4.343 -9.807 -0.575 36.745 -5.487 ...
feature_engineering
Deadline: Oct 22, 22:00 3 points
Starting with the feature_engineering.py
template, learn how to perform basic feature engineering using scikit-learn.
Note that your results may be slightly different (because of varying floating point arithmetic on your CPU).
python3 feature_engineering.py --dataset=diabetes
-0.5745 -0.9514 1.797 -0.4984 0.4751 0.9487 -0.6961 0.7574 0.06019 1.625 0.33 0.5465 -1.033 0.2863 -0.2729 -0.545 0.3999 -0.4351 -0.03458 -0.9334 0.9052 -1.71 0.4742 -0.452 -0.9026 0.6623 -0.7206 -0.05727 -1.546 3.23 -0.8959 0.8539 1.705 -1.251 1.361 0.1082 2.92 0.2484 -0.2368 -0.4729 0.347 -0.3775 -0.03 -0.8099 0.2257 0.4507 -0.3307 0.3598 0.0286 0.7719 0.9 -0.6604 0.7185 0.0571 1.541 0.4845 -0.5272 -0.0419 -1.131 0.5736 0.04559 1.231 0.003623 0.0978 2.64
0.2776 -0.9514 0.08366 -1.148 -1.592 -1.397 -0.4687 -0.7816 -0.3766 -1.973 0.07706 -0.2641 0.02322 -0.3186 -0.442 -0.3878 -0.1301 -0.217 -0.1045 -0.5477 0.9052 -0.0796 1.092 1.515 1.329 0.4459 0.7436 0.3583 1.877 0.007 -0.09602 -0.1332 -0.1169 -0.03921 -0.06539 -0.03151 -0.1651 1.317 1.827 1.603 0.5379 0.8971 0.4322 2.264 2.535 2.224 0.7462 1.245 0.5996 3.141 1.952 0.6548 1.092 0.5261 2.757 0.2197 0.3663 0.1765 0.9247 0.6109 0.2944 1.542 0.1418 0.7431 3.893
0.8198 1.051 -0.683 -0.8108 -0.6896 -0.4871 -0.2413 -0.03186 -0.2682 0.04527 0.6721 0.8617 -0.5599 -0.6647 -0.5653 -0.3993 -0.1978 -0.02612 -0.2199 0.03711 1.105 -0.7179 -0.8522 -0.7248 -0.512 -0.2536 -0.03348 -0.2819 0.04758 0.4665 0.5538 0.471 0.3327 0.1648 0.02176 0.1832 -0.03092 0.6574 0.5591 0.3949 0.1956 0.02583 0.2175 -0.0367 0.4755 0.3359 0.1664 0.02197 0.185 -0.03121 0.2373 0.1175 0.01552 0.1306 -0.02205 0.05822 0.007686 0.06472 -0.01092 0.001015 0.008544 -0.001442 0.07194 -0.01214 0.002049
0.9747 1.051 1.211 0.6803 0.6207 -0.9859 -1.151 1.547 2.783 2.853 0.9501 1.025 1.18 0.6631 0.605 -0.961 -1.122 1.508 2.712 2.781 1.105 1.273 0.715 0.6524 -1.036 -1.21 1.626 2.925 2.999 1.467 0.8239 0.7517 -1.194 -1.394 1.873 3.37 3.456 0.4628 0.4222 -0.6707 -0.7829 1.052 1.893 1.941 0.3852 -0.6119 -0.7143 0.96 1.727 1.771 0.972 1.135 -1.525 -2.743 -2.813 1.325 -1.78 -3.203 -3.284 2.392 4.304 4.413 7.743 7.94 8.142
-0.1872 -0.9514 0.1739 -1.171 -0.5149 -0.8915 0.5925 -0.8211 0.3554 -0.1302 0.03503 0.1781 -0.03254 0.2193 0.09637 0.1669 -0.1109 0.1537 -0.06651 0.02438 0.9052 -0.1654 1.115 0.4899 0.8482 -0.5637 0.7812 -0.3381 0.1239 0.03023 -0.2037 -0.08952 -0.155 0.103 -0.1428 0.06178 -0.02264 1.372 0.6032 1.044 -0.6941 0.9619 -0.4163 0.1526 0.2651 0.459 -0.3051 0.4228 -0.183 0.06706 0.7948 -0.5282 0.732 -0.3168 0.1161 0.3511 -0.4865 0.2106 -0.07717 0.6742 -0.2918 0.1069 0.1263 -0.04628 0.01696
0.9747 -0.9514 -0.1869 -0.3058 2.659 2.728 0.3651 0.7574 0.676 -0.1302 0.9501 -0.9274 -0.1822 -0.2981 2.592 2.659 0.3559 0.7382 0.6589 -0.1269 0.9052 0.1778 0.291 -2.53 -2.596 -0.3474 -0.7206 -0.6431 0.1239 0.03494 0.05717 -0.497 -0.51 -0.06824 -0.1416 -0.1264 0.02434 0.09354 -0.8132 -0.8344 -0.1117 -0.2316 -0.2067 0.03983 7.07 7.254 0.9708 2.014 1.797 -0.3463 7.443 0.9961 2.066 1.844 -0.3553 0.1333 0.2765 0.2468 -0.04755 0.5736 0.512 -0.09864 0.457 -0.08804 0.01696
1.982 -0.9514 0.715 0.4877 -0.5149 -0.3253 -0.01389 -0.8211 -0.4683 -0.4813 3.927 -1.885 1.417 0.9664 -1.02 -0.6447 -0.02753 -1.627 -0.928 -0.9537 0.9052 -0.6803 -0.464 0.4899 0.3095 0.01322 0.7812 0.4455 0.4579 0.5113 0.3487 -0.3682 -0.2326 -0.009932 -0.5871 -0.3348 -0.3441 0.2378 -0.2511 -0.1586 -0.006774 -0.4004 -0.2284 -0.2347 0.2651 0.1675 0.007152 0.4228 0.2411 0.2478 0.1058 0.004519 0.2671 0.1523 0.1566 0.000193 0.01141 0.006505 0.006685 0.6742 0.3845 0.3952 0.2193 0.2254 0.2316
1.362 1.051 -0.1418 -0.2337 2.193 1.084 1.123 -0.03186 1.76 -0.3935 1.855 1.432 -0.1932 -0.3183 2.987 1.476 1.53 -0.04339 2.397 -0.536 1.105 -0.1491 -0.2456 2.305 1.139 1.18 -0.03348 1.85 -0.4136 0.02011 0.03314 -0.311 -0.1537 -0.1593 0.004518 -0.2496 0.05581 0.05462 -0.5125 -0.2532 -0.2625 0.007445 -0.4113 0.09196 4.809 2.376 2.463 -0.06986 3.86 -0.8629 1.174 1.217 -0.03452 1.907 -0.4264 1.261 -0.03578 1.977 -0.4419 0.001015 -0.05607 0.01253 3.098 -0.6926 0.1548
2.059 -0.9514 1.031 1.69 1.174 0.8206 -1.606 3.046 2.055 1.274 4.24 -1.959 2.122 3.48 2.417 1.69 -3.306 6.273 4.231 2.623 0.9052 -0.9806 -1.608 -1.117 -0.7807 1.528 -2.898 -1.955 -1.212 1.062 1.742 1.21 0.8458 -1.655 3.14 2.118 1.313 2.857 1.984 1.387 -2.714 5.149 3.473 2.153 1.378 0.9633 -1.885 3.576 2.412 1.495 0.6734 -1.318 2.5 1.686 1.045 2.578 -4.891 -3.3 -2.045 9.279 6.26 3.88 4.223 2.618 1.623
0.2776 1.051 -0.48 -0.0173 0.8245 1.178 -0.1655 0.7574 -0.1065 -0.218 0.07706 0.2918 -0.1333 -0.004801 0.2289 0.327 -0.04594 0.2102 -0.02956 -0.06051 1.105 -0.5046 -0.01818 0.8666 1.238 -0.1739 0.7961 -0.1119 -0.2291 0.2304 0.008303 -0.3958 -0.5654 0.07944 -0.3636 0.05111 0.1046 0.0002992 -0.01426 -0.02037 0.002862 -0.0131 0.001842 0.00377 0.6798 0.9711 -0.1364 0.6245 -0.08779 -0.1797 1.387 -0.1949 0.8921 -0.1254 -0.2568 0.02739 -0.1253 0.01762 0.03608 0.5736 -0.08064 -0.1651 0.01134 0.02321 0.04752
python3 feature_engineering.py --dataset=linnerud
1 0 0 0 0 0 0 0 1 0 0 0 0 0 0 0 0 0 0 0 0 1 0 0 0 0 1 0 0 0 0 0 0 0 1 0 0 0 0 0 0 0 0 0 0 0 0 1 0 0 0 0 0 0 0 0 0 0 0 0 0 0 0 0 0 0 0 0 0 0 0 0 0 0 0 0 0 0 0 0 0 0 0 0 0 0 0 0 0 0 0 0 0 0 0 0 0 0 0 0 0 0 0 0 0 0 0 0 0 0 0 0 0 0 0 0 0 0 0 0 0 0 0 0 0 0 0 0 0 0 0 0 0 0 0 0 0 0 0 0 ...
0 0 0 0 1 0 0 0 0 0 1 0 0 0 0 0 0 0 0 0 0 0 0 1 0 0 0 0 0 0 0 0 0 0 0 0 0 0 0 0 0 0 0 0 0 0 0 0 0 0 0 0 0 0 0 0 0 0 0 0 0 0 0 0 0 0 0 0 0 0 0 0 0 0 0 0 0 0 0 0 0 0 0 0 0 0 0 0 0 0 0 0 0 0 0 0 0 0 0 0 0 0 0 0 0 0 0 0 0 0 0 0 0 0 0 0 0 0 0 0 0 0 0 0 1 0 0 0 0 0 1 0 0 0 0 0 0 0 0 0 ...
0 0 0 0 0 0 0 1 0 0 0 0 0 0 0 0 1 0 0 0 0 0 0 0 0 1 0 0 0 0 0 0 0 0 0 0 0 0 0 0 0 0 0 0 0 0 0 0 0 0 0 0 0 0 0 0 0 0 0 0 0 0 0 0 0 0 0 0 0 0 0 0 0 0 0 0 0 0 0 0 0 0 0 0 0 0 0 0 0 0 0 0 0 0 0 0 0 0 0 0 0 0 0 0 0 0 0 0 0 0 0 0 0 0 0 0 0 0 0 0 0 0 0 0 0 0 0 0 0 0 0 0 0 0 0 0 0 0 0 0 ...
0 1 0 0 0 0 0 0 0 0 0 1 0 0 0 0 0 0 0 0 1 0 0 0 0 0 0 0 0 0 0 0 0 0 0 0 0 0 0 0 0 0 0 0 0 0 0 0 0 0 0 0 1 0 0 0 0 0 0 0 0 0 1 0 0 0 0 0 0 0 0 1 0 0 0 0 0 0 0 0 0 0 0 0 0 0 0 0 0 0 0 0 0 0 0 0 0 0 0 0 0 0 0 0 0 0 0 0 0 0 0 0 0 0 0 0 0 0 0 0 0 0 0 0 0 0 0 0 0 0 0 0 0 0 0 0 0 0 0 0 ...
0 0 0 0 0 1 0 0 0 0 0 0 0 0 1 0 0 0 0 0 0 0 1 0 0 0 0 0 0 0 0 0 0 0 0 0 0 0 0 0 0 0 0 0 0 0 0 0 0 0 0 0 0 0 0 0 0 0 0 0 0 0 0 0 0 0 0 0 0 0 0 0 0 0 0 0 0 0 0 0 0 0 0 0 0 0 0 0 0 0 0 0 0 0 0 0 0 0 0 0 0 0 0 0 0 0 0 0 0 0 0 0 0 0 0 0 0 0 0 0 0 0 0 0 0 0 0 0 0 0 0 0 0 0 0 0 0 0 0 0 ...
0 0 0 0 0 0 0 0 0 0 0 0 0 0 0 0 0 0 0 0 0 0 0 0 0 0 0 0 0 0 0 0 0 0 0 0 0 0 0 0 0 0 0 0 0 0 0 0 0 0 0 0 0 0 0 0 0 0 0 0 0 0 0 0 0 0 0 0 0 0 0 0 0 0 0 0 0 0 0 0 0 0 0 0 0 0 0 0 0 0 0 0 0 0 0 0 0 0 0 0 0 0 0 0 0 0 0 0 0 0 0 0 0 0 0 0 0 0 0 0 0 0 0 0 0 0 0 0 0 0 0 0 0 0 0 0 0 0 0 0 ...
0 0 0 0 0 0 0 0 0 0 0 0 0 0 0 0 0 0 0 0 0 0 0 0 0 0 0 0 0 0 0 0 0 0 0 0 0 0 0 0 0 0 0 0 0 0 0 0 0 0 0 0 0 0 0 0 0 0 0 0 0 0 0 0 0 0 0 0 0 0 0 0 0 0 0 0 0 0 0 0 0 0 0 0 0 0 0 0 0 0 0 0 0 0 0 0 0 0 0 0 0 0 0 0 0 0 0 0 0 0 0 0 0 0 0 0 0 0 0 0 0 0 0 0 0 0 0 0 0 0 0 0 0 0 0 0 0 0 0 0 ...
0 0 0 0 1 0 0 0 0 0 0 0 0 0 0 0 0 0 0 0 0 0 0 0 0 0 0 0 0 0 0 0 0 0 0 0 0 0 0 0 0 0 0 0 0 0 0 0 0 0 0 0 0 0 0 0 0 0 0 0 0 0 0 0 0 0 0 0 0 0 0 0 0 0 0 0 0 0 0 0 0 0 0 0 0 0 0 0 0 0 0 0 0 0 0 0 0 0 0 0 0 0 0 0 0 0 0 0 0 0 0 0 0 0 0 0 0 0 0 0 0 0 0 0 1 0 0 0 0 0 0 0 0 0 0 0 0 0 0 0 ...
0 1 0 0 0 0 0 0 0 0 0 1 0 0 0 0 0 0 0 0 0 0 0 0 0 0 0 0 0 0 0 0 0 0 0 0 0 0 0 0 0 0 0 0 0 0 0 0 0 0 0 0 1 0 0 0 0 0 0 0 0 0 1 0 0 0 0 0 0 0 0 0 0 0 0 0 0 0 0 0 0 0 0 0 0 0 0 0 0 0 0 0 0 0 0 0 0 0 0 0 0 0 0 0 0 0 0 0 0 0 0 0 0 0 0 0 0 0 0 0 0 0 0 0 0 0 0 0 0 0 0 0 0 0 0 0 0 0 0 0 ...
0 0 0 0 0 0 0 0 0 0 0 0 0 0 0 0 0 0 0 1 0 0 0 0 0 0 0 0 0 0 0 0 0 0 0 0 0 0 0 0 0 0 0 0 0 0 0 0 0 0 0 0 0 0 0 0 0 0 0 0 0 0 0 0 0 0 0 0 0 0 0 0 0 0 0 0 0 0 0 0 0 0 0 0 0 0 0 0 0 0 0 0 0 0 0 0 0 0 0 0 0 0 0 0 0 0 0 0 0 0 0 0 0 0 0 0 0 0 0 0 0 0 0 0 0 0 0 0 0 0 0 0 0 0 0 0 0 0 0 0 ...
python3 feature_engineering.py --dataset=wine
0 0 0 0 0 0 0 0 0 0 0 0 0 0 0 0 0 0 0 1 0 0 0 0 0 0 0 0 0 0 0 0 0 0 0 0 0 0 0 0 0 0 0 0 0 0 0 0 0 0 0 0 0 0 0 1 0 0 0 0 0 0 0 0 0 0 0 0 0 0 0 0 0 0 0 0 0 0 0 0 0 0 0 0 0 0 0 0 0 0 0 0 0 0 0 0 0 0 0 0 0 0 0 0 0 0 0 0 0 0 0 0 0 -0.2976 1.31 0.1177 0.9155 0.7783 0.5271 0.4232 0.6668 -1.122 1.048 0.7913 0 0 0 0 0 0 0 0 0 0 0 0 0 0 0 0 ...
0 0 0 0 0 0 0 0 0 0 0 0 0 1 0 0 0 0 0 0 0 0 0 0 0 0 0 0 0 0 0 0 0 0 0 0 0 0 0 0 0 0 0 0 0 0 0 0 0 0 0 0 0 0 0 0 0 0 0 0 0 0 0 0 1 0 0 0 0 0 0 0 0 0 0 0 0 0 0 0 0 0 0 0 0 0 0 0 0 0 0 0 0 0 0 0 0 0 0 0 0 0 0 0 0 0 0 0 0 0 0 0 0 -1.282 -1.41 0.8239 -0.4697 -0.1538 0.2001 -1.152 1.377 -0.9146 -0.6609 0.7232 0 0 0 0 0 0 0 0 0 0 0 0 0 0 0 0 ...
0 0 0 0 0 0 0 0 0 0 0 0 0 0 0 0 0 0 0 0 0 0 0 0 0 0 0 0 0 0 0 0 0 0 0 0 0 0 0 1 0 0 0 0 0 0 0 0 0 0 0 0 0 0 0 0 0 0 0 0 0 0 0 0 0 0 0 0 0 0 0 0 0 0 0 0 0 0 0 0 0 0 0 0 0 1 0 0 0 0 0 0 0 0 0 0 0 0 0 0 0 0 0 0 0 0 0 0 0 0 0 0 0 1.442 1.419 0.5492 -1.8 1.03 0.9984 -1.302 0.8977 -0.02794 -0.2336 1.336 0 0 0 0 0 0 0 0 0 0 0 0 0 0 0 0 ...
0 0 0 0 0 0 0 1 0 0 0 0 0 0 0 0 0 0 0 0 0 0 0 0 0 0 0 0 0 0 0 0 0 0 0 0 0 0 0 0 0 0 0 0 0 0 0 0 0 0 0 0 0 0 0 0 0 0 0 0 0 0 0 0 0 0 0 0 1 0 0 0 0 0 0 0 0 0 0 0 0 0 0 0 0 0 0 0 0 0 0 0 0 0 0 0 0 0 0 0 0 0 0 0 0 0 0 0 0 0 0 0 0 -0.4121 -0.9989 -1.844 -0.3312 -1.263 -0.6176 -0.6272 -0.3989 -1.174 0.4073 0.301 0 0 0 0 0 0 0 0 0 0 0 0 0 0 0 0 ...
0 0 0 0 0 0 0 0 0 1 0 0 0 0 0 0 0 0 0 0 0 0 0 0 0 0 0 0 0 0 0 0 0 0 0 0 0 0 0 0 0 0 0 0 0 0 0 0 0 0 0 0 0 0 0 0 0 0 0 0 1 0 0 0 0 0 0 0 0 0 0 0 0 0 0 0 0 0 0 0 0 0 0 0 0 0 0 0 0 0 0 0 0 0 0 0 0 0 0 0 0 0 0 0 0 0 0 0 0 0 0 0 0 -0.9155 -0.7526 -0.2354 0.8601 -0.7751 -0.3001 0.4232 -0.02594 -1.174 1.646 -0.3936 0 0 0 0 0 0 0 0 0 0 0 0 0 0 0 0 ...
0 0 0 0 0 0 0 0 0 0 0 0 0 0 0 0 0 0 0 0 0 0 0 0 0 0 0 0 0 0 0 0 1 0 0 0 0 0 0 0 0 0 0 0 0 0 0 0 0 0 0 0 0 0 0 0 0 0 0 0 0 0 0 0 0 0 0 0 0 0 0 0 0 0 0 0 0 0 0 0 0 0 0 0 0 0 0 0 0 0 0 0 0 0 0 0 0 0 0 0 0 0 0 0 0 0 0 0 0 0 0 0 0 0.778 0.6071 0.7454 -1.245 0.586 0.9888 -1.527 0.1517 -0.02794 0.06549 1.105 0 0 0 0 0 0 0 0 0 0 0 0 0 0 0 0 ...
0 0 0 0 0 0 0 0 0 0 0 0 0 0 0 0 0 0 0 0 0 0 0 0 0 0 0 0 1 0 0 0 0 0 0 0 0 0 0 0 0 0 0 0 0 0 0 0 0 0 0 0 0 0 0 0 0 0 0 0 0 0 0 0 0 0 0 0 0 0 0 0 0 0 0 0 0 0 0 0 0 0 0 0 0 0 0 0 0 0 0 0 0 0 0 0 0 0 0 0 0 0 0 0 0 0 0 0 0 0 0 0 0 1.43 1.465 0.2746 -0.2204 0.8079 0.6233 -0.5521 -0.5766 0.03261 -0.3191 1.064 0 0 0 0 0 0 0 0 0 0 0 0 0 0 0 0 ...
0 0 0 0 0 0 0 0 0 0 0 0 0 0 0 1 0 0 0 0 0 0 0 0 0 0 0 0 0 0 0 0 0 0 0 0 0 0 0 0 0 0 0 0 0 0 0 0 0 0 0 0 0 0 0 0 0 0 0 0 0 0 0 0 0 0 0 0 0 0 0 0 1 0 0 0 0 0 0 0 0 0 0 0 0 0 0 0 0 0 0 0 0 0 0 0 0 0 0 0 0 0 0 0 0 0 0 0 0 0 0 0 0 -0.03446 0.3424 1.295 0.3614 -1.13 -1.445 1.173 -1.465 -0.2442 -0.7464 -0.3255 0 0 0 0 0 0 0 0 0 0 0 0 0 0 0 0 ...
0 0 0 0 0 0 0 0 0 0 0 0 0 0 0 0 0 0 0 1 0 0 0 0 0 0 0 0 0 0 0 0 0 0 0 0 0 0 0 0 0 0 0 0 0 0 0 0 0 0 0 0 0 0 0 0 0 0 0 0 0 0 0 0 0 0 0 0 0 0 0 0 0 0 0 0 0 0 0 0 0 0 0 0 0 0 0 0 0 0 0 0 0 0 0 0 0 0 0 0 0 0 0 0 0 0 0 1 0 0 0 0 0 0.8809 -0.8529 1.295 0.777 1.03 1.2 -0.6272 1.431 0.2316 1.048 0.2193 0 0 0 0 0 0 0 0 0 0 0 0 0 0 0 0 ...
0 0 0 0 0 0 0 0 0 0 0 0 0 0 0 0 0 0 0 0 0 0 0 0 0 0 0 0 0 0 0 0 0 0 0 0 0 0 0 0 0 0 0 0 0 0 0 0 0 0 0 0 0 0 0 0 0 0 0 0 0 0 1 0 0 0 0 0 0 0 0 0 0 0 0 0 0 0 0 0 0 0 0 0 0 0 0 0 0 0 0 0 0 0 0 0 0 0 0 0 0 0 0 0 0 0 0 0 0 0 0 0 0 -0.6752 -1.154 -1.765 -0.02646 -0.2869 -0.001945 -0.7772 -0.9496 -0.2096 0.7491 1.268 0 0 0 0 0 0 0 0 0 0 0 0 0 0 0 0 ...
rental_competition
Deadline: Oct 22, 22:00 3 points+4 bonus
This assignment is a competition task. Your goal is to perform regression on the data from a bike rental shop. The train set contains 1000 instances, each instance consists of 12 features, both integral and real.
The rental_competition.py template shows how to load the training data, downloading it if needed. Furthermore, it shows how to save a trained estimator and how to load it during prediction.
The performance of your system is measured using root mean squared error and your goal is to achieve RMSE less than 100. Note that you can use any number of generalized linear models from sklearn to solve this assignment (but no other ML models like decision trees, MLPs, …; however, you can use any supporting methods like pre/post-processing, data manipulation, evaluation, cross-validation, …).
perceptron
Deadline: Oct 29, 22:00 2 points
Starting with the perceptron.py template, implement the perceptron algorithm.
Note that your results may be slightly different (because of varying floating point arithmetic on your CPU).
python3 perceptron.py --data_size=100 --seed=17
Learned weights 4.10 2.94 -1.00
python3 perceptron.py --data_size=50 --seed=320
Learned weights -2.30 -1.96 -2.00
python3 perceptron.py --data_size=200 --seed=92
Learned weights 4.43 1.54 -2.00
logistic_regression_sgd
Deadline: Oct 29, 22:00 5 points
Starting with the logistic_regression_sgd.py, implement minibatch SGD for logistic regression.
Note that your results may be slightly different (because of varying floating point arithmetic on your CPU).
python3 logistic_regression_sgd.py --data_size=100 --batch_size=10 --epochs=9 --learning_rate=0.5
After epoch 1: train loss 0.3259 acc 94.0%, test loss 0.3301 acc 96.0%
After epoch 2: train loss 0.2321 acc 96.0%, test loss 0.2385 acc 98.0%
After epoch 3: train loss 0.1877 acc 98.0%, test loss 0.1949 acc 98.0%
After epoch 4: train loss 0.1612 acc 98.0%, test loss 0.1689 acc 98.0%
After epoch 5: train loss 0.1435 acc 98.0%, test loss 0.1517 acc 98.0%
After epoch 6: train loss 0.1307 acc 98.0%, test loss 0.1396 acc 98.0%
After epoch 7: train loss 0.1208 acc 98.0%, test loss 0.1304 acc 96.0%
After epoch 8: train loss 0.1129 acc 98.0%, test loss 0.1230 acc 96.0%
After epoch 9: train loss 0.1065 acc 98.0%, test loss 0.1170 acc 96.0%
Learned weights 2.77 -0.60 0.12
python3 logistic_regression_sgd.py --data_size=95 --test_size=45 --batch_size=5 --epochs=9 --learning_rate=0.5
After epoch 1: train loss 0.2429 acc 96.0%, test loss 0.3187 acc 93.3%
After epoch 2: train loss 0.1853 acc 96.0%, test loss 0.2724 acc 93.3%
After epoch 3: train loss 0.1590 acc 96.0%, test loss 0.2525 acc 93.3%
After epoch 4: train loss 0.1428 acc 96.0%, test loss 0.2411 acc 93.3%
After epoch 5: train loss 0.1313 acc 98.0%, test loss 0.2335 acc 93.3%
After epoch 6: train loss 0.1225 acc 96.0%, test loss 0.2258 acc 93.3%
After epoch 7: train loss 0.1159 acc 96.0%, test loss 0.2220 acc 93.3%
After epoch 8: train loss 0.1105 acc 96.0%, test loss 0.2187 acc 93.3%
After epoch 9: train loss 0.1061 acc 96.0%, test loss 0.2163 acc 93.3%
Learned weights -0.61 3.61 0.12
python3 logistic_regression_sgd.py --data_size=95 --test_size=45 --batch_size=1 --epochs=9 --learning_rate=0.7
After epoch 1: train loss 0.1141 acc 96.0%, test loss 0.2268 acc 93.3%
After epoch 2: train loss 0.0867 acc 96.0%, test loss 0.2150 acc 91.1%
After epoch 3: train loss 0.0797 acc 98.0%, test loss 0.2320 acc 88.9%
After epoch 4: train loss 0.0753 acc 96.0%, test loss 0.2224 acc 88.9%
After epoch 5: train loss 0.0692 acc 96.0%, test loss 0.2154 acc 88.9%
After epoch 6: train loss 0.0749 acc 98.0%, test loss 0.2458 acc 88.9%
After epoch 7: train loss 0.0638 acc 96.0%, test loss 0.2190 acc 88.9%
After epoch 8: train loss 0.0644 acc 98.0%, test loss 0.2341 acc 88.9%
After epoch 9: train loss 0.0663 acc 98.0%, test loss 0.2490 acc 88.9%
Learned weights -1.07 7.33 -0.40
grid_search
Deadline: Oct 29, 22:00 2 points
Starting with grid_search.py
template, perform a hyperparameter grid search, evaluating hyperparameter performance
using a stratified k-fold crossvalidation, and finally evaluate a model
trained with best hyperparameters on all training data. The easiest way is
to utilize sklearn.model_selection.GridSearchCV.
Note that your results may be slightly different (because of varying floating point arithmetic on your CPU).
python3 grid_search.py --test_size=0.5
Test accuracy: 98.11%
python3 grid_search.py --test_size=0.7
Test accuracy: 96.26%
Note that your results may be slightly different (because of varying floating point arithmetic on your CPU).
python3 grid_search.py --test_size=0.5
Rank: 11 Cross-val: 86.7% lr__C: 0.01  lr__solver: lbfgs polynomial__degree: 1
Rank:  5 Cross-val: 92.7% lr__C: 0.01  lr__solver: lbfgs polynomial__degree: 2
Rank: 11 Cross-val: 86.7% lr__C: 0.01  lr__solver: sag   polynomial__degree: 1
Rank:  5 Cross-val: 92.7% lr__C: 0.01  lr__solver: sag   polynomial__degree: 2
Rank:  7 Cross-val: 91.0% lr__C: 1     lr__solver: lbfgs polynomial__degree: 1
Rank:  2 Cross-val: 96.8% lr__C: 1     lr__solver: lbfgs polynomial__degree: 2
Rank:  8 Cross-val: 90.8% lr__C: 1     lr__solver: sag   polynomial__degree: 1
Rank:  3 Cross-val: 96.8% lr__C: 1     lr__solver: sag   polynomial__degree: 2
Rank: 10 Cross-val: 90.1% lr__C: 100   lr__solver: lbfgs polynomial__degree: 1
Rank:  4 Cross-val: 96.4% lr__C: 100   lr__solver: lbfgs polynomial__degree: 2
Rank:  9 Cross-val: 90.5% lr__C: 100   lr__solver: sag   polynomial__degree: 1
Rank:  1 Cross-val: 97.0% lr__C: 100   lr__solver: sag   polynomial__degree: 2
Test accuracy: 98.11%
python3 grid_search.py --test_size=0.7
Rank: 11 Cross-val: 87.9% lr__C: 0.01  lr__solver: lbfgs polynomial__degree: 1
Rank:  5 Cross-val: 91.8% lr__C: 0.01  lr__solver: lbfgs polynomial__degree: 2
Rank: 11 Cross-val: 87.9% lr__C: 0.01  lr__solver: sag   polynomial__degree: 1
Rank:  5 Cross-val: 91.8% lr__C: 0.01  lr__solver: sag   polynomial__degree: 2
Rank:  7 Cross-val: 91.5% lr__C: 1     lr__solver: lbfgs polynomial__degree: 1
Rank:  2 Cross-val: 95.9% lr__C: 1     lr__solver: lbfgs polynomial__degree: 2
Rank:  8 Cross-val: 91.3% lr__C: 1     lr__solver: sag   polynomial__degree: 1
Rank:  3 Cross-val: 95.7% lr__C: 1     lr__solver: sag   polynomial__degree: 2
Rank:  9 Cross-val: 89.4% lr__C: 100   lr__solver: lbfgs polynomial__degree: 1
Rank:  4 Cross-val: 95.2% lr__C: 100   lr__solver: lbfgs polynomial__degree: 2
Rank: 10 Cross-val: 89.2% lr__C: 100   lr__solver: sag   polynomial__degree: 1
Rank:  1 Cross-val: 96.1% lr__C: 100   lr__solver: sag   polynomial__degree: 2
Test accuracy: 96.26%
thyroid_competition
Deadline: Oct 29, 22:00 3 points+4 bonus
This assignment is a competition task. Your goal is to perform binary classification – given medical data with 15 binary and 6 real-valued attributes, predict whether thyroid is functioning normally or not. The train set and test set consist of ~3.5k instances.
The thyroid_competition.py template shows how to load training data, downloading it if needed. Furthermore, it shows how to save a trained estimator and how to load it during prediction.
The performance of your system is measured using accuracy of correctly predicted examples and your goal is to achieve at least 96% accuracy. Note that you can use any number of generalized linear models from sklearn to solve this assignment (but no other ML models like decision trees, MLPs, …; however, you can use any supporting methods like pre/post-processing, data manipulation, evaluation, cross-validation, …).
softmax_classification_sgd
Deadline: Nov 5, 22:00 3 points
Starting with the softmax_classification_sgd.py, implement minibatch SGD for multinomial logistic regression.
Note that your results may be slightly different (because of varying floating point arithmetic on your CPU).
python3 softmax_classification_sgd.py --batch_size=10 --epochs=2 --learning_rate=0.005
After epoch 1: train loss 0.4097 acc 87.6%, test loss 0.6056 acc 81.8%
After epoch 2: train loss 0.1842 acc 95.3%, test loss 0.2684 acc 92.6%
Learned weights:
  -0.04 0.04 0.06 0.09 -0.02 -0.12 -0.00 -0.10 0.06 0.04 ...
  -0.08 -0.09 -0.08 -0.08 -0.07 -0.02 -0.08 -0.01 0.07 -0.05 ...
  -0.05 -0.01 -0.01 0.04 -0.01 -0.08 0.07 0.09 0.03 0.04 ...
  -0.02 -0.07 0.08 0.02 -0.02 0.08 0.04 -0.00 -0.01 0.06 ...
  -0.09 -0.06 -0.02 -0.16 0.04 -0.15 -0.06 -0.09 -0.07 -0.08 ...
  -0.06 0.08 0.14 0.08 -0.04 0.12 0.02 -0.09 0.07 -0.01 ...
  0.10 -0.09 0.02 0.02 -0.08 -0.02 -0.02 -0.06 -0.03 -0.07 ...
  0.03 0.02 0.03 -0.05 0.06 0.01 0.08 0.09 -0.09 -0.05 ...
  0.03 0.07 0.02 -0.09 -0.05 -0.02 -0.08 0.09 -0.03 0.05 ...
  0.00 -0.09 0.10 -0.02 -0.05 -0.01 -0.04 -0.09 -0.04 -0.03 ...
python3 softmax_classification_sgd.py --batch_size=1 --epochs=1 --learning_rate=0.005 --test_size=1597
After epoch 1: train loss 1.3350 acc 77.5%, test loss 1.7405 acc 75.2%
Learned weights:
  -0.04 0.04 0.05 0.09 -0.00 -0.15 0.01 -0.10 0.06 0.04 ...
  -0.08 -0.09 -0.15 -0.18 -0.09 -0.02 -0.13 -0.01 0.08 -0.13 ...
  -0.05 0.04 0.14 0.16 0.00 -0.04 0.07 0.10 0.04 0.17 ...
  -0.02 -0.08 0.13 0.12 -0.01 0.08 0.06 -0.01 -0.01 0.10 ...
  -0.09 -0.07 -0.12 -0.21 -0.00 -0.25 -0.08 -0.09 -0.07 -0.14 ...
  -0.06 0.05 0.15 0.06 0.04 0.27 0.20 -0.08 0.07 -0.12 ...
  0.10 -0.08 0.02 -0.01 -0.17 -0.04 -0.02 -0.06 -0.03 -0.08 ...
  0.03 0.03 0.16 0.04 0.14 0.09 0.12 0.09 -0.09 0.01 ...
  0.03 0.05 -0.11 -0.23 -0.17 -0.13 -0.13 0.10 -0.03 0.03 ...
  0.00 -0.10 0.06 0.02 0.02 -0.02 -0.16 -0.10 -0.04 0.00 ...
python3 softmax_classification_sgd.py --batch_size=100 --epochs=3 --learning_rate=0.05
After epoch 1: train loss 1.8101 acc 79.4%, test loss 2.3757 acc 75.2%
After epoch 2: train loss 1.8213 acc 79.1%, test loss 2.3803 acc 75.0%
After epoch 3: train loss 0.2346 acc 93.6%, test loss 0.3357 acc 91.5%
Learned weights:
  -0.04 0.03 0.04 0.11 -0.01 -0.14 -0.01 -0.11 0.06 0.02 ...
  -0.08 -0.09 -0.18 -0.15 -0.14 0.02 -0.07 -0.01 0.07 -0.09 ...
  -0.05 0.00 0.06 0.08 -0.01 -0.14 0.05 0.09 0.03 0.09 ...
  -0.02 -0.07 0.18 0.07 0.04 0.18 0.08 -0.00 -0.01 0.14 ...
  -0.09 -0.06 -0.09 -0.25 0.04 -0.26 -0.11 -0.09 -0.07 -0.11 ...
  -0.06 0.09 0.21 0.10 0.01 0.25 0.08 -0.09 0.07 -0.01 ...
  0.10 -0.09 -0.03 0.03 -0.11 -0.06 -0.02 -0.06 -0.03 -0.10 ...
  0.03 0.03 0.04 -0.01 0.12 0.09 0.13 0.10 -0.09 -0.04 ...
  0.03 0.06 0.00 -0.13 -0.09 -0.11 -0.14 0.09 -0.03 0.02 ...
  0.00 -0.09 0.12 0.00 -0.08 -0.02 -0.03 -0.09 -0.04 -0.03 ...
Note that your results may be slightly different (because of varying floating point arithmetic on your CPU).
python3 softmax_classification_sgd.py --batch_size=10 --epochs=10 --learning_rate=0.005
After epoch 1: train loss 0.4097 acc 87.6%, test loss 0.6056 acc 81.8%
After epoch 2: train loss 0.1842 acc 95.3%, test loss 0.2684 acc 92.6%
After epoch 3: train loss 0.1589 acc 95.4%, test loss 0.2366 acc 92.7%
After epoch 4: train loss 0.1509 acc 95.9%, test loss 0.2568 acc 91.2%
After epoch 5: train loss 0.1184 acc 96.6%, test loss 0.2067 acc 92.6%
After epoch 6: train loss 0.1052 acc 96.7%, test loss 0.1756 acc 94.6%
After epoch 7: train loss 0.0839 acc 97.2%, test loss 0.1704 acc 94.5%
After epoch 8: train loss 0.0898 acc 97.8%, test loss 0.1826 acc 94.0%
After epoch 9: train loss 0.0910 acc 97.3%, test loss 0.2099 acc 92.7%
After epoch 10: train loss 0.0717 acc 98.4%, test loss 0.1574 acc 95.4%
Learned weights:
  -0.04 0.04 0.06 0.10 -0.02 -0.14 -0.02 -0.11 0.06 0.03 ...
  -0.08 -0.09 -0.06 -0.03 -0.16 0.07 -0.07 -0.01 0.07 -0.07 ...
  -0.05 -0.00 0.02 0.02 -0.00 -0.05 0.07 0.09 0.03 0.07 ...
  -0.02 -0.07 0.04 0.03 0.06 0.10 0.03 -0.00 -0.01 0.08 ...
  -0.09 -0.06 -0.01 -0.21 -0.02 -0.19 -0.08 -0.09 -0.07 -0.07 ...
  -0.06 0.08 0.19 0.09 -0.03 0.16 0.06 -0.09 0.07 -0.01 ...
  0.10 -0.09 -0.01 -0.00 -0.08 -0.06 -0.02 -0.06 -0.03 -0.08 ...
  0.03 0.02 0.04 -0.05 0.07 0.03 0.11 0.10 -0.09 -0.05 ...
  0.03 0.07 -0.01 -0.09 -0.01 -0.06 -0.11 0.09 -0.03 0.02 ...
  0.00 -0.09 0.09 0.01 -0.05 -0.05 -0.03 -0.09 -0.04 -0.02 ...
python3 softmax_classification_sgd.py --batch_size=1 --epochs=10 --learning_rate=0.005 --test_size=1597
After epoch 1: train loss 1.3350 acc 77.5%, test loss 1.7405 acc 75.2%
After epoch 2: train loss 0.4239 acc 89.0%, test loss 1.3121 acc 83.5%
After epoch 3: train loss 0.1724 acc 94.0%, test loss 0.8195 acc 85.7%
After epoch 4: train loss 0.4967 acc 91.0%, test loss 1.1503 acc 82.8%
After epoch 5: train loss 0.2448 acc 94.0%, test loss 0.6896 acc 88.0%
After epoch 6: train loss 0.0123 acc 99.5%, test loss 0.5975 acc 91.3%
After epoch 7: train loss 0.0113 acc 99.5%, test loss 0.5783 acc 91.0%
After epoch 8: train loss 0.2608 acc 92.5%, test loss 1.0018 acc 86.7%
After epoch 9: train loss 0.0182 acc 99.5%, test loss 0.5316 acc 91.7%
After epoch 10: train loss 0.0321 acc 99.0%, test loss 0.5806 acc 90.8%
Learned weights:
  -0.04 0.04 0.05 0.08 0.01 -0.18 -0.02 -0.10 0.06 0.01 ...
  -0.08 -0.11 0.03 -0.08 -0.48 0.12 -0.10 -0.01 0.08 -0.25 ...
  -0.05 0.02 0.12 0.14 -0.04 -0.13 0.04 0.10 0.04 0.14 ...
  -0.02 -0.05 0.05 0.03 0.24 0.33 0.17 -0.01 -0.01 0.14 ...
  -0.09 -0.07 -0.19 -0.29 -0.02 -0.33 -0.23 -0.11 -0.07 -0.15 ...
  -0.06 0.07 0.35 0.11 0.18 0.39 0.18 -0.08 0.07 -0.06 ...
  0.10 -0.08 -0.07 -0.17 -0.11 -0.03 -0.02 -0.06 -0.03 -0.10 ...
  0.03 0.03 0.15 0.08 0.22 0.12 0.24 0.12 -0.09 0.02 ...
  0.03 0.05 -0.32 -0.31 -0.25 -0.24 -0.16 0.10 -0.03 0.08 ...
  0.00 -0.11 0.17 0.26 0.02 -0.25 -0.18 -0.11 -0.04 0.06 ...
python3 softmax_classification_sgd.py --batch_size=100 --epochs=10 --learning_rate=0.05
After epoch 1: train loss 1.8101 acc 79.4%, test loss 2.3757 acc 75.2%
After epoch 2: train loss 1.8213 acc 79.1%, test loss 2.3803 acc 75.0%
After epoch 3: train loss 0.2346 acc 93.6%, test loss 0.3357 acc 91.5%
After epoch 4: train loss 0.2589 acc 93.4%, test loss 0.4630 acc 88.5%
After epoch 5: train loss 0.1534 acc 96.0%, test loss 0.2766 acc 93.2%
After epoch 6: train loss 0.1057 acc 96.7%, test loss 0.2160 acc 93.7%
After epoch 7: train loss 0.1069 acc 96.7%, test loss 0.2495 acc 93.4%
After epoch 8: train loss 0.0955 acc 97.0%, test loss 0.2198 acc 93.7%
After epoch 9: train loss 0.0866 acc 97.5%, test loss 0.2234 acc 94.6%
After epoch 10: train loss 0.1401 acc 96.3%, test loss 0.2675 acc 93.0%
Learned weights:
  -0.04 0.03 0.04 0.11 -0.02 -0.16 -0.03 -0.11 0.06 0.01 ...
  -0.08 -0.09 -0.12 -0.05 -0.21 0.09 -0.07 -0.01 0.07 -0.09 ...
  -0.05 0.00 0.05 0.05 -0.00 -0.10 0.05 0.09 0.04 0.10 ...
  -0.02 -0.07 0.10 0.05 0.09 0.21 0.06 -0.00 -0.01 0.13 ...
  -0.09 -0.06 -0.06 -0.29 -0.03 -0.28 -0.14 -0.09 -0.07 -0.10 ...
  -0.06 0.09 0.25 0.10 -0.01 0.23 0.11 -0.09 0.07 -0.00 ...
  0.10 -0.09 -0.05 -0.02 -0.10 -0.08 -0.02 -0.06 -0.03 -0.11 ...
  0.03 0.03 0.05 0.00 0.13 0.08 0.14 0.11 -0.09 -0.04 ...
  0.03 0.06 -0.03 -0.13 -0.02 -0.10 -0.15 0.09 -0.03 0.02 ...
  0.00 -0.10 0.11 0.04 -0.06 -0.07 -0.02 -0.10 -0.04 -0.03 ...
mlp_classification_sgd
Deadline: Nov 5, 22:00 6 points
Starting with the mlp_classification_sgd.py, implement minibatch SGD for multilayer perceptron classification.
Note that your results may be slightly different (because of varying floating point arithmetic on your CPU).
python3 mlp_classification_sgd.py --epochs=3 --batch_size=10 --hidden_layer=20
After epoch 1: train acc 79.7%, test acc 80.2%
After epoch 2: train acc 91.9%, test acc 88.3%
After epoch 3: train acc 92.4%, test acc 90.0%
Learned parameters:
  -0.03 0.09 0.05 0.02 -0.07 -0.07 -0.09 0.07 0.02 0.04 -0.10 0.09 ...
  -0.09 0.07 0.21 -0.16 -0.15 -0.07 0.01 -0.09 0.05 -0.11 -0.02 -0.04 ...
  -0.00 -0.00 0.00 0.00 0.00 0.00 -0.00 0.00 0.00 -0.00 0.00 -0.00 ...
  0.01 -0.01 0.01 -0.02 0.01 -0.01 0.00 0.01 0.01 -0.01 ...
python3 mlp_classification_sgd.py --epochs=3 --batch_size=10 --hidden_layer=50
After epoch 1: train acc 91.1%, test acc 89.2%
After epoch 2: train acc 95.9%, test acc 93.5%
After epoch 3: train acc 96.5%, test acc 95.2%
Learned parameters:
  -0.03 0.09 0.05 0.02 -0.07 -0.07 -0.09 0.07 0.02 0.04 -0.10 0.09 ...
  0.01 0.06 -0.13 0.04 0.11 0.04 0.13 0.01 0.05 -0.05 -0.07 0.02 ...
  0.00 0.00 -0.00 0.00 -0.00 0.00 -0.00 0.00 0.00 -0.00 -0.00 -0.00 ...
  0.01 0.00 -0.00 0.00 -0.00 0.00 -0.01 -0.00 -0.00 0.00 ...
python3 mlp_classification_sgd.py --epochs=3 --batch_size=10 --hidden_layer=200
After epoch 1: train acc 95.4%, test acc 93.0%
After epoch 2: train acc 97.9%, test acc 96.6%
After epoch 3: train acc 98.8%, test acc 96.9%
Learned parameters:
  -0.03 0.09 0.05 0.02 -0.07 -0.07 -0.09 0.07 0.02 0.04 -0.10 0.09 ...
  0.01 -0.09 0.04 -0.09 0.06 0.06 -0.05 -0.04 -0.00 0.02 -0.04 0.02 ...
  0.00 0.00 -0.00 -0.00 0.00 -0.00 0.00 -0.00 0.00 0.00 -0.00 -0.00 ...
  -0.00 -0.00 -0.00 -0.00 0.00 -0.00 -0.00 0.00 0.00 0.00 ...
python3 mlp_classification_sgd.py --epochs=1 --batch_size=1 --hidden_layer=200 --test_size=1597
After epoch 1: train acc 74.0%, test acc 68.7%
Learned parameters:
  -0.03 0.09 0.05 0.02 -0.07 -0.07 -0.09 0.07 0.02 0.04 -0.10 0.09 ...
  0.01 -0.09 0.04 -0.09 0.06 0.06 -0.05 -0.04 -0.00 0.02 -0.04 0.02 ...
  0.00 0.00 -0.00 -0.00 -0.00 -0.00 -0.00 -0.00 0.00 -0.00 -0.00 -0.00 ...
  -0.02 0.01 -0.00 -0.02 0.02 -0.00 0.00 -0.02 0.02 0.01 ...
Note that your results may be slightly different (because of varying floating point arithmetic on your CPU).
python3 mlp_classification_sgd.py --epochs=10 --batch_size=10 --hidden_layer=20
After epoch 1: train acc 79.7%, test acc 80.2%
After epoch 2: train acc 91.9%, test acc 88.3%
After epoch 3: train acc 92.4%, test acc 90.0%
After epoch 4: train acc 96.1%, test acc 93.1%
After epoch 5: train acc 95.3%, test acc 93.1%
After epoch 6: train acc 96.6%, test acc 93.9%
After epoch 7: train acc 97.3%, test acc 94.2%
After epoch 8: train acc 98.2%, test acc 94.9%
After epoch 9: train acc 98.1%, test acc 95.7%
After epoch 10: train acc 97.4%, test acc 95.1%
Learned parameters:
  -0.03 0.09 0.05 0.02 -0.07 -0.07 -0.09 0.07 0.02 0.04 -0.10 0.09 ...
  -0.07 0.12 0.33 -0.21 -0.16 -0.13 0.02 -0.14 0.01 -0.12 -0.02 -0.04 ...
  -0.00 -0.00 0.00 -0.00 0.00 0.00 -0.00 0.00 0.00 -0.00 0.00 0.00 ...
  0.02 -0.01 0.01 -0.03 0.02 -0.01 0.00 0.01 0.01 -0.01 ...
python3 mlp_classification_sgd.py --epochs=10 --batch_size=10 --hidden_layer=50
After epoch 1: train acc 91.1%, test acc 89.2%
After epoch 2: train acc 95.9%, test acc 93.5%
After epoch 3: train acc 96.5%, test acc 95.2%
After epoch 4: train acc 96.1%, test acc 94.5%
After epoch 5: train acc 96.3%, test acc 93.5%
After epoch 6: train acc 98.3%, test acc 96.2%
After epoch 7: train acc 98.4%, test acc 96.4%
After epoch 8: train acc 98.3%, test acc 95.7%
After epoch 9: train acc 99.1%, test acc 97.4%
After epoch 10: train acc 98.8%, test acc 97.4%
Learned parameters:
  -0.03 0.09 0.05 0.02 -0.07 -0.07 -0.09 0.07 0.02 0.04 -0.10 0.09 ...
  0.01 0.10 -0.16 0.02 0.13 0.04 0.14 -0.01 0.05 -0.07 -0.08 0.02 ...
  0.00 0.00 -0.00 0.00 0.00 -0.00 -0.00 0.00 0.00 -0.00 -0.00 -0.00 ...
  0.01 -0.00 -0.00 0.00 0.00 0.00 -0.01 0.00 -0.00 -0.00 ...
python3 mlp_classification_sgd.py --epochs=10 --batch_size=10 --hidden_layer=200
After epoch 1: train acc 95.4%, test acc 93.0%
After epoch 2: train acc 97.9%, test acc 96.6%
After epoch 3: train acc 98.8%, test acc 96.9%
After epoch 4: train acc 98.0%, test acc 95.4%
After epoch 5: train acc 99.6%, test acc 97.7%
After epoch 6: train acc 99.7%, test acc 98.0%
After epoch 7: train acc 97.4%, test acc 95.4%
After epoch 8: train acc 99.7%, test acc 97.5%
After epoch 9: train acc 99.8%, test acc 97.9%
After epoch 10: train acc 99.9%, test acc 97.9%
Learned parameters:
  -0.03 0.09 0.05 0.02 -0.07 -0.07 -0.09 0.07 0.02 0.04 -0.10 0.09 ...
  0.01 -0.09 0.04 -0.09 0.06 0.06 -0.05 -0.04 -0.00 0.02 -0.04 0.02 ...
  0.00 0.00 0.00 -0.00 0.00 -0.00 -0.00 -0.00 0.00 0.00 0.00 -0.00 ...
  -0.00 -0.01 -0.00 -0.00 0.00 -0.00 -0.00 0.00 0.01 0.00 ...
mnist_competition
Deadline: Nov 5, 22:00 4 points+5 bonus
This assignment is a competition task. Your goal is to perform 10-class classification on the well-known MNIST dataset. The train set contains 60k images, each consisting of pixels with values in . Evaluation is performed on 10k test images. You can find a simple online demo of a trained classifier here.
The mnist_competition.py template shows how to load training data, downloading it if needed. Furthermore, it shows how to save a trained estimator and how to load it during prediction.
The performance of your system is measured using accuracy of correctly predicted examples and your goal is to achieve at least 97% accuracy. Note that you can use any sklearn algorithm to solve this exercise (and of course anything you implement yourself).
multilabel_classification_sgd
Deadline: Nov 12, 22:00 2 points
Starting with the multilabel_classification_sgd.py, implement minibatch SGD for multi-label classification and manually compute micro-averaged and macro-averaged -score.
Note that your results may be slightly different (because of varying floating point arithmetic on your CPU).
python3 multilabel_classification_sgd.py --batch_size=10 --epochs=2 --classes=5
After epoch 1: train F1 micro 56.45% macro 46.71%, test F1 micro 58.25% macro 43.9%
After epoch 2: train F1 micro 71.46% macro 59.47%, test F1 micro 73.77% macro 60.3%
Learned weights:
  -0.05 -0.11 -0.12 -0.05 0.04 0.04 0.02 0.01 -0.05 0.03 ...
  0.05 -0.01 0.09 -0.05 -0.06 -0.08 -0.05 0.02 0.03 0.00 ...
  0.10 0.16 0.08 0.01 -0.02 -0.05 -0.11 -0.09 -0.04 0.05 ...
  0.03 0.00 -0.06 -0.01 0.01 0.06 0.10 0.08 0.12 0.01 ...
  -0.03 -0.02 -0.08 -0.05 -0.07 -0.05 0.06 -0.03 -0.09 -0.09 ...
python3 multilabel_classification_sgd.py --batch_size=10 --epochs=2 --classes=10
After epoch 1: train F1 micro 20.14% macro 9.95%, test F1 micro 21.57% macro 10.4%
After epoch 2: train F1 micro 11.29% macro 7.35%, test F1 micro 14.45% macro 8.8%
Learned weights:
  -0.04 -0.09 -0.01 -0.01 -0.09 0.02 0.01 0.04 0.02 -0.11 ...
  0.12 0.07 -0.09 -0.07 0.04 0.02 -0.06 -0.03 0.03 0.05 ...
  0.05 0.03 -0.11 -0.13 -0.09 0.08 0.02 -0.14 -0.01 -0.00 ...
  -0.03 -0.07 0.00 0.09 0.08 0.01 -0.01 -0.04 -0.08 -0.02 ...
  -0.11 -0.11 -0.04 0.04 -0.11 -0.03 -0.08 -0.03 -0.07 0.03 ...
  -0.11 -0.07 0.04 0.04 -0.00 0.04 0.00 -0.03 -0.06 -0.05 ...
  -0.14 -0.08 -0.12 -0.09 -0.11 -0.15 -0.09 -0.01 0.01 -0.05 ...
  0.04 0.00 -0.08 -0.10 -0.06 -0.04 -0.01 -0.10 -0.00 0.02 ...
  0.03 0.01 0.04 0.03 -0.06 -0.10 -0.09 0.04 0.02 -0.10 ...
  0.04 -0.06 -0.07 -0.03 -0.09 0.04 0.05 -0.09 -0.04 -0.10 ...
python3 multilabel_classification_sgd.py --batch_size=5 --epochs=2 --classes=5 --learning_rate=0.02
After epoch 1: train F1 micro 60.66% macro 47.96%, test F1 micro 60.82% macro 46.6%
After epoch 2: train F1 micro 79.28% macro 77.99%, test F1 micro 77.65% macro 71.1%
Learned weights:
  -0.08 -0.15 -0.14 -0.01 0.09 0.03 0.04 -0.08 0.03 0.08 ...
  -0.06 0.09 0.04 -0.06 -0.08 -0.13 -0.06 0.11 0.07 0.01 ...
  0.21 0.28 0.12 0.03 0.02 -0.16 -0.16 -0.14 0.06 0.13 ...
  0.07 -0.00 -0.04 0.00 0.12 0.13 0.11 0.19 0.21 0.03 ...
  0.07 -0.10 -0.10 -0.04 -0.19 0.05 0.01 -0.03 -0.15 -0.10 ...
Note that your results may be slightly different (because of varying floating point arithmetic on your CPU).
python3 multilabel_classification_sgd.py --batch_size=10 --epochs=9 --classes=5
After epoch 1: train F1 micro 56.45% macro 46.71%, test F1 micro 58.25% macro 43.9%
After epoch 2: train F1 micro 71.46% macro 59.47%, test F1 micro 73.77% macro 60.3%
After epoch 3: train F1 micro 73.06% macro 61.02%, test F1 micro 71.71% macro 56.8%
After epoch 4: train F1 micro 77.30% macro 66.48%, test F1 micro 76.19% macro 64.1%
After epoch 5: train F1 micro 76.05% macro 67.34%, test F1 micro 74.46% macro 61.4%
After epoch 6: train F1 micro 78.22% macro 73.24%, test F1 micro 77.40% macro 66.1%
After epoch 7: train F1 micro 78.13% macro 73.33%, test F1 micro 74.41% macro 61.7%
After epoch 8: train F1 micro 78.92% macro 74.73%, test F1 micro 76.78% macro 66.9%
After epoch 9: train F1 micro 80.76% macro 76.31%, test F1 micro 78.18% macro 68.3%
Learned weights:
  -0.09 -0.17 -0.16 -0.01 0.09 0.01 0.04 -0.09 0.04 0.07 ...
  -0.08 0.09 0.02 -0.07 -0.08 -0.13 -0.07 0.09 0.06 0.01 ...
  0.20 0.25 0.09 0.00 0.02 -0.18 -0.18 -0.15 0.06 0.07 ...
  0.06 -0.04 -0.07 -0.01 0.10 0.13 0.10 0.17 0.20 -0.01 ...
  0.06 -0.11 -0.12 -0.05 -0.20 0.04 -0.01 -0.03 -0.16 -0.11 ...
python3 multilabel_classification_sgd.py --batch_size=10 --epochs=9 --classes=10
After epoch 1: train F1 micro 20.14% macro 9.95%, test F1 micro 21.57% macro 10.4%
After epoch 2: train F1 micro 11.29% macro 7.35%, test F1 micro 14.45% macro 8.8%
After epoch 3: train F1 micro 41.53% macro 26.29%, test F1 micro 33.54% macro 20.4%
After epoch 4: train F1 micro 44.23% macro 30.24%, test F1 micro 37.85% macro 24.4%
After epoch 5: train F1 micro 43.23% macro 29.85%, test F1 micro 42.37% macro 28.3%
After epoch 6: train F1 micro 49.53% macro 35.63%, test F1 micro 46.53% macro 32.2%
After epoch 7: train F1 micro 55.69% macro 40.36%, test F1 micro 48.21% macro 33.8%
After epoch 8: train F1 micro 52.47% macro 37.65%, test F1 micro 46.53% macro 31.9%
After epoch 9: train F1 micro 59.89% macro 43.27%, test F1 micro 53.44% macro 37.5%
Learned weights:
  -0.02 -0.04 -0.02 -0.08 -0.04 -0.10 0.12 0.04 -0.06 -0.15 ...
  0.18 0.04 -0.10 -0.06 0.15 -0.06 -0.08 0.05 0.05 0.05 ...
  0.13 -0.02 -0.20 -0.20 -0.01 0.13 -0.06 -0.15 0.09 -0.08 ...
  -0.05 -0.08 0.11 0.12 0.13 -0.07 0.05 -0.22 -0.02 -0.02 ...
  -0.09 -0.14 -0.00 -0.02 -0.10 -0.05 -0.09 -0.08 -0.06 0.07 ...
  -0.10 -0.01 0.11 0.03 0.03 0.04 0.05 -0.11 -0.04 -0.10 ...
  -0.16 -0.09 -0.13 -0.11 -0.10 -0.20 -0.04 -0.00 0.04 -0.08 ...
  -0.03 0.05 -0.21 -0.09 -0.12 0.03 -0.13 -0.09 -0.02 0.13 ...
  0.05 0.07 0.08 0.04 -0.18 -0.11 -0.09 0.18 -0.09 -0.07 ...
  0.04 -0.10 0.00 -0.07 -0.15 0.17 -0.03 -0.12 -0.12 -0.16 ...
python3 multilabel_classification_sgd.py --batch_size=5 --epochs=9 --classes=5 --learning_rate=0.02
After epoch 1: train F1 micro 60.66% macro 47.96%, test F1 micro 60.82% macro 46.6%
After epoch 2: train F1 micro 79.28% macro 77.99%, test F1 micro 77.65% macro 71.1%
After epoch 3: train F1 micro 80.27% macro 74.86%, test F1 micro 79.57% macro 69.6%
After epoch 4: train F1 micro 81.22% macro 79.85%, test F1 micro 77.41% macro 70.1%
After epoch 5: train F1 micro 80.50% macro 78.76%, test F1 micro 72.54% macro 65.1%
After epoch 6: train F1 micro 82.86% macro 81.46%, test F1 micro 75.62% macro 69.2%
After epoch 7: train F1 micro 81.19% macro 79.54%, test F1 micro 72.51% macro 65.3%
After epoch 8: train F1 micro 81.37% macro 79.59%, test F1 micro 75.06% macro 68.9%
After epoch 9: train F1 micro 83.83% macro 82.38%, test F1 micro 79.74% macro 74.3%
Learned weights:
  -0.18 -0.31 -0.23 0.05 0.12 -0.02 0.09 -0.25 0.21 0.16 ...
  -0.21 0.18 -0.12 -0.08 -0.13 -0.17 -0.12 0.15 0.10 0.04 ...
  0.47 0.32 0.13 0.01 0.09 -0.36 -0.29 -0.26 0.27 0.14 ...
  0.12 -0.07 -0.11 0.04 0.28 0.21 0.11 0.28 0.39 0.04 ...
  0.22 -0.24 -0.26 -0.03 -0.48 0.06 -0.10 0.01 -0.28 -0.14 ...
diacritization
Deadline: Nov 12, 22:00 5 points+5 bonus
The goal of the diacritization competition task
is to learn to add diacritics to the given Czech text. We will use a small
collection of fiction books,
which is available under CC BY-NC-SA license.
Note that these texts are the only allowed training data, you cannot use any
other Czech texts (even manually annotated) to train or evaluate your model.
At the test time, you will be given a text without diacritics and you should return
it including diacritical marks – to be explicit, we only consider diacritized
letters áčďéěíňóřšťúůýž and their uppercase variants.
The diacritization.py template shows how to load the training data, downloading it if needed.
Each sentence in the data is stored on a single line, with exactly one space character separating input words. The performance of your system is measured using word accuracy (the percentage of words you diacritized correctly, as computed by the diacritization_eval.py script) and your goal is to achieve at least 86.5%. You can use any sklearn algorithm with the exception of decision trees to solve this assignment (so no random forests, extra trees, gradient boosting, AdaBoost with decision trees, …).
tf_idf
Deadline: Nov 19, 22:00 3 points
Using the tf_idf.py
template, perform classification of text documents from the
20 Newsgroups dataset. To represent the
documents, use TF and/or IDF weights, which you implement manually (without
using the sklearn.feature_extraction module in any way). Classify test set
documents using sklearn.linear_model.LogisticRegression trained on the
given training data, and report macro -score.
Note that your results may be slightly different (because of varying floating point arithmetic on your CPU).
python3 tf_idf.py --train_size=1000 --test_size=500
Number of unique terms with at least two occurrences: 12855
F-1 score for TF=False, IDF=False: 40.7%
python3 tf_idf.py --train_size=1000 --test_size=500 --tf
Number of unique terms with at least two occurrences: 12855
F-1 score for TF=True, IDF=False: 44.5%
python3 tf_idf.py --train_size=1000 --test_size=500 --idf
Number of unique terms with at least two occurrences: 12855
F-1 score for TF=False, IDF=True: 54.1%
python3 tf_idf.py --train_size=1000 --test_size=500 --tf --idf
Number of unique terms with at least two occurrences: 12855
F-1 score for TF=True, IDF=True: 61.8%
python3 tf_idf.py --train_size=3000 --test_size=500
Number of unique terms with at least two occurrences: 26587
F-1 score for TF=False, IDF=False: 58.6%
python3 tf_idf.py --train_size=3000 --test_size=500 --tf
Number of unique terms with at least two occurrences: 26587
F-1 score for TF=True, IDF=False: 64.0%
python3 tf_idf.py --train_size=3000 --test_size=500 --idf
Number of unique terms with at least two occurrences: 26587
F-1 score for TF=False, IDF=True: 64.7%
python3 tf_idf.py --train_size=3000 --test_size=500 --tf --idf
Number of unique terms with at least two occurrences: 26587
F-1 score for TF=True, IDF=True: 72.8%
imdb_sentiment
Deadline: Nov 19, 22:00 3 points
Using the imdb_sentiment.py template, perform classification of text documents from the Large Movie Review Dataset. The template also downloads pretrained word embeddings from FastText containing only words from our dataset; these embeddings are available in ReCodEx during evaluation.
Analogously to competition assignments, your task is to submit a trained model that will perform classification on the test set given to you during ReCodEx evaluation. The performance is measured using accuracy, and your goal is to achieve at least 80%.
diacritization_dictionary
Deadline: Nov 19, 22:00 4 points+4 bonus
The diacritization_dictionary is an extension of the diacritization competition.
In addition to the original training data,
in this task you can also use a dictionary providing all known diacritized
variants
of word forms present in the training and testing data, available again under
CC BY-NC-SA license.
The dictionary is not guaranteed to contain all words from the training and
testing data, but if it contains a word, all valid Czech diacritization variants
should be present.
The rules of the competition are the same as of the diacritization competition,
except that
- you can utilize the dictionary, both during training and inference;
- in order to pass, you need to achieve at least 95% word accuracy.
The diacritization_dictionary.py
module provides a Dictionary class, which loads the dictionary
(downloading it if necessary), exposing it in Dictionary.variants field
as a mapping from undiacritized word form to a list of known diacritized
variants.
Note that the fiction-dictionary.txt is available in ReCodEx during evaluation.
k_nearest_neighbors
Deadline: Nov 26, 22:00 3 points
Starting with the k_nearest_neighbors.py,
implement k-nearest neighbors algorithm for classifying MNIST, without using the
sklearn.neighbors module or scipy.spatial module in any way.
Note that your results may be slightly different (because of varying floating point arithmetic on your CPU).
python3 k_nearest_neighbors.py --k=1 --p=2 --weights=uniform --test_size=500 --train_size=100
K-nn accuracy for 1 nearest neighbors, L_2 metric, uniform weights: 73.60%
python3 k_nearest_neighbors.py --k=3 --p=2 --weights=uniform --test_size=500 --train_size=100
K-nn accuracy for 3 nearest neighbors, L_2 metric, uniform weights: 66.80%
python3 k_nearest_neighbors.py --k=1 --p=2 --weights=uniform --test_size=500 --train_size=1000
K-nn accuracy for 1 nearest neighbors, L_2 metric, uniform weights: 90.40%
python3 k_nearest_neighbors.py --k=5 --p=2 --weights=uniform --test_size=500 --train_size=1000
K-nn accuracy for 5 nearest neighbors, L_2 metric, uniform weights: 88.40%
python3 k_nearest_neighbors.py --k=5 --p=1 --weights=uniform --test_size=500 --train_size=1000
K-nn accuracy for 5 nearest neighbors, L_1 metric, uniform weights: 87.00%
python3 k_nearest_neighbors.py --k=5 --p=3 --weights=uniform --test_size=500 --train_size=1000
K-nn accuracy for 5 nearest neighbors, L_3 metric, uniform weights: 89.40%
python3 k_nearest_neighbors.py --k=1 --p=2 --weights=uniform --test_size=500 --train_size=5000
K-nn accuracy for 1 nearest neighbors, L_2 metric, uniform weights: 94.40%
python3 k_nearest_neighbors.py --k=9 --p=2 --weights=uniform --test_size=500 --train_size=5000
K-nn accuracy for 9 nearest neighbors, L_2 metric, uniform weights: 92.80%
python3 k_nearest_neighbors.py --k=9 --p=2 --weights=inverse --test_size=500 --train_size=5000
K-nn accuracy for 9 nearest neighbors, L_2 metric, inverse weights: 93.00%
python3 k_nearest_neighbors.py --k=9 --p=2 --weights=softmax --test_size=500 --train_size=5000
K-nn accuracy for 9 nearest neighbors, L_2 metric, softmax weights: 94.00%
naive_bayes
Deadline: Nov 26, 22:00 3 points
Using the naive_bayes.py
template, implement a naive Bayes classifier (without using the
sklearn.naive_bayes module in any way). Support all of Gaussian NB,
multinomial NB and Bernoulli NB.
Note that your results may be slightly different (because of varying floating point arithmetic on your CPU).
python3 naive_bayes.py --classes=3 --naive_bayes_type=bernoulli
Test accuracy 95.17%, log probability -4933.45
python3 naive_bayes.py --classes=3 --naive_bayes_type=multinomial
Test accuracy 93.68%, log probability -300352.40
python3 naive_bayes.py --classes=3 --naive_bayes_type=gaussian
Test accuracy 95.54%, log probability -31895.82
python3 naive_bayes.py --classes=10 --naive_bayes_type=bernoulli
Test accuracy 89.21%, log probability -18342.14
python3 naive_bayes.py --classes=10 --naive_bayes_type=bernoulli --alpha=10
Test accuracy 88.54%, log probability -20829.42
python3 naive_bayes.py --classes=10 --naive_bayes_type=multinomial --alpha=10
Test accuracy 90.32%, log probability -1006524.57
python3 naive_bayes.py --classes=10 --naive_bayes_type=gaussian --alpha=10
Test accuracy 92.10%, log probability -149703.75
isnt_it_ironic
Deadline: Nov 26, 22:00 3 points+4 bonus
The goal of the isnt_it_ironic competition task is to learn to
classify given text as ironic or not.
The isnt_it_ironic.py template shows how to load the training data, downloading it if needed. Please note that the data are provided only for the purpose of this class and you cannot use them in any other way.
Each instance is a string of an English tweet. The texts have already been tokenized and tokens are separated by exactly one space. The performance of your solution will be evaluated using -score with sklearn.metrics.f1_score and if you surpass 61%, you will obtain 3 points. Note that you can use any sklearn algorithm to solve this exercise (or anything you implement yourselves).
You might find TfidfTransformer or TfidfVectorizer useful.
metric_correlation
Deadline: Dec 3, 22:00 3 points
Using the metric_correlation.py template, find a for which -score correlates best with human ratings.
We use an artificial dataset, which for every sentence contains:
- the number of edits that must be performed for every sentence (for example in grammar error correction, where the number would be computed by comparing input erroneous sentences and manually corrected ones),
- the number of edits proposed by a model,
- the number of correct edits proposed by a model,
- human rating of the sentence (with the proposed edits applied).
Using bootstrap resampling, compute the mean human rating and -score for each sampled dataset, then manually compute the Pearson correlation for betas between 0 and 2, and return the beta with highest correlation.
Note that your results may be slightly different (because of varying floating point arithmetic on your CPU).
python3 metric_correlation.py --bootstrap_samples=100 --data_size=1000
Best correlation of 0.711 was found for beta 0.79
python3 metric_correlation.py --bootstrap_samples=100 --data_size=2000
Best correlation of 0.726 was found for beta 0.63
python3 metric_correlation.py --bootstrap_samples=200 --data_size=2000
Best correlation of 0.676 was found for beta 0.61
decision_tree
Deadline: Dec 10, 22:00 4 points
Starting with the decision_tree.py,
manually implement construction of a classification decision tree, supporting both
gini and entropy criteria, and max_depth, min_to_split and max_leaves
constraints.
We recommend using object-oriented programming to implement the decision tree classifier; if you are not familiar with it, now is a good time to go through some tutorials. Regarding the API of your decision tree implementation, you can take inspiration from scikit-learn itself.
Note that your results may be slightly different (because of varying floating point arithmetic on your CPU).
python3 decision_tree.py --dataset=digits --criterion=gini --min_to_split=250
Train accuracy: 60.7%
Test accuracy: 59.6%
python3 decision_tree.py --dataset=digits --criterion=gini --max_depth=3
Train accuracy: 41.1%
Test accuracy: 38.0%
python3 decision_tree.py --dataset=digits --criterion=gini --max_leaves=8
Train accuracy: 60.1%
Test accuracy: 57.1%
python3 decision_tree.py --dataset=digits --criterion=gini --min_to_split=220 --max_leaves=8
Train accuracy: 60.7%
Test accuracy: 59.6%
python3 decision_tree.py --dataset=digits --criterion=entropy --min_to_split=420
Train accuracy: 42.4%
Test accuracy: 40.2%
python3 decision_tree.py --dataset=breast_cancer --criterion=entropy --max_depth=3 --seed=44
Train accuracy: 94.8%
Test accuracy: 93.7%
python3 decision_tree.py --dataset=digits --criterion=entropy --max_leaves=7
Train accuracy: 53.2%
Test accuracy: 51.6%
python3 decision_tree.py --dataset=breast_cancer --criterion=entropy --min_to_split=55 --max_depth=3 --seed=44
Train accuracy: 94.4%
Test accuracy: 93.7%
Note that your results may be slightly different (because of varying floating point arithmetic on your CPU).
python3 decision_tree.py --dataset=iris --max_depth=3
Train accuracy: 95.5%
Test accuracy: 100.0%
python3 decision_tree.py --dataset=wine --criterion=entropy --min_to_split=20 --seed=44
Train accuracy: 97.7%
Test accuracy: 91.1%
python3 decision_tree.py --dataset=breast_cancer --criterion=entropy --max_depth=3 --seed=44
Train accuracy: 94.8%
Test accuracy: 93.7%
random_forest
Deadline: Dec 10, 22:00 3 points
Using the random_forest.py template, train a random forest, which is a collection of decision trees trained with dataset bagging and random feature subsampling.
Note that your results may be slightly different (because of varying floating point arithmetic on your CPU).
python3 random_forest.py --dataset=digits --trees=10 --max_depth=3
Train accuracy: 56.3%
Test accuracy: 51.6%
python3 random_forest.py --dataset=digits --trees=10 --bagging --max_depth=3
Train accuracy: 73.1%
Test accuracy: 70.7%
python3 random_forest.py --dataset=digits --trees=10 --feature_subsampling=0.5 --max_depth=3
Train accuracy: 77.2%
Test accuracy: 74.4%
python3 random_forest.py --dataset=digits --trees=10 --bagging --feature_subsampling=0.5 --max_depth=3
Train accuracy: 74.4%
Test accuracy: 74.0%
python3 random_forest.py --dataset=wine --trees=10 --max_depth=3
Train accuracy: 97.0%
Test accuracy: 80.0%
python3 random_forest.py --dataset=wine --trees=10 --bagging --max_depth=3
Train accuracy: 99.2%
Test accuracy: 97.8%
python3 random_forest.py --dataset=breast_cancer --trees=10 --feature_subsampling=0.5 --max_depth=3
Train accuracy: 98.6%
Test accuracy: 95.8%
python3 random_forest.py --dataset=breast_cancer --trees=10 --bagging --feature_subsampling=0.5 --max_depth=3
Train accuracy: 98.4%
Test accuracy: 97.9%
Note that your results may be slightly different (because of varying floating point arithmetic on your CPU).
python3 random_forest.py --dataset=wine --trees=3 --max_depth=3
Train accuracy: 97.0%
Test accuracy: 80.0%
python3 random_forest.py --dataset=wine --trees=3 --bagging --max_depth=3
Train accuracy: 94.7%
Test accuracy: 88.9%
python3 random_forest.py --dataset=wine --trees=3 --feature_subsampling=0.5 --max_depth=3
Train accuracy: 98.5%
Test accuracy: 97.8%
python3 random_forest.py --dataset=wine --trees=3 --bagging --feature_subsampling=0.5 --max_depth=3
Train accuracy: 95.5%
Test accuracy: 86.7%
miniaturization
Deadline: Dec 10, 22:00 3 points+4 bonus
This assignment is a competition task. Your goal is to submit the smallest model achieving at least 99% accuracy on the MNIST dataset. The total size of your submission must be at most 1 MiB, and the competition points will be awarded according to the size of your submission, which ReCodEx shows in the logs (the accuracy of your solution does not affect the competition points, as long as it is at least 99%, and is therefore not hidden as usual).
The miniaturization.py
template shows how to load training data, downloading it if needed.
Furthermore, it shows how to save a trained estimator and how to load it during
prediction. Finally, it includes a class MLPFullDistributionClassifier, which
modifies MLPClassifier to support full categorical distributions on input,
i.e., each label is a distribution over the predicted classes. Such a classifier
might be useful for example for knowledge distillation.
You can use any sklearn/numpy/scipy algorithm to solve this exercise (and of course anything you implement yourself).
gradient_boosting
Deadline: Dec 17, 22:00 6 points
Using the gradient_boosting.py template, train gradient-boosted decision tree forest for classification.
Note that your results may be slightly different (because of varying floating point arithmetic on your CPU).
python3 gradient_boosting.py --dataset=wine --trees=3 --max_depth=1 --learning_rate=0.3
Using 1 trees, train accuracy: 95.5%, test accuracy: 91.1%
Using 2 trees, train accuracy: 95.5%, test accuracy: 86.7%
Using 3 trees, train accuracy: 97.7%, test accuracy: 91.1%
python3 gradient_boosting.py --dataset=wine --trees=3 --max_depth=2 --learning_rate=0.3 --seed=883
Using 1 trees, train accuracy: 100.0%, test accuracy: 88.9%
Using 2 trees, train accuracy: 99.2%, test accuracy: 93.3%
Using 3 trees, train accuracy: 99.2%, test accuracy: 97.8%
python3 gradient_boosting.py --dataset=wine --trees=3 --max_depth=2 --l2=0.5 --learning_rate=0.3 --seed=488
Using 1 trees, train accuracy: 97.0%, test accuracy: 95.6%
Using 2 trees, train accuracy: 98.5%, test accuracy: 97.8%
Using 3 trees, train accuracy: 99.2%, test accuracy: 97.8%
python3 gradient_boosting.py --dataset=digits --trees=3 --max_depth=2 --learning_rate=0.5
Using 1 trees, train accuracy: 79.1%, test accuracy: 76.9%
Using 2 trees, train accuracy: 85.7%, test accuracy: 84.4%
Using 3 trees, train accuracy: 91.3%, test accuracy: 87.8%
python3 gradient_boosting.py --dataset=breast_cancer --trees=3 --max_depth=2 --learning_rate=0.5 --seed=45
Using 1 trees, train accuracy: 94.6%, test accuracy: 90.2%
Using 2 trees, train accuracy: 96.9%, test accuracy: 95.1%
Using 3 trees, train accuracy: 96.9%, test accuracy: 93.7%
human_activity_recognition
Deadline: Dec 17, 22:00 2 points+4 bonus
The goal of this competition task
is to perform human activity recognition, namely to recognize one
of five actions (walking, standing, sitting, standing up, sitting down)
using data from four accelerometers. The train set consists of 50k
examples, the test set of approximately 115k.
The human_activity_recognition.py template shows how to load the training data, downloading it if needed.
Your model will be evaluated using accuracy and your goal is to achieve at least 99.25%. Note that you can use any sklearn algorithm to solve this assignment.
pca
Deadline: Jan 7, 22:00 3 points
Using the pca.py template, implement the PCA computation with both
- power iteration algorithm,
- singular value decomposition (SVD).
Note that your results may be slightly different (because of varying floating point arithmetic on your CPU).
python3 pca.py --max_iter=5
Test set accuracy: 90.48%
python3 pca.py --max_iter=5 --pca=1
Test set accuracy: 30.36%
python3 pca.py --max_iter=5 --pca=5
Test set accuracy: 68.76%
python3 pca.py --max_iter=5 --pca=10
Test set accuracy: 80.32%
python3 pca.py --max_iter=5 --pca=20
Test set accuracy: 87.56%
python3 pca.py --max_iter=5 --pca=50
Test set accuracy: 89.88%
python3 pca.py --max_iter=5 --pca=100
Test set accuracy: 90.32%
python3 pca.py --max_iter=5 --pca=200
Test set accuracy: 90.28%
Note that your results may be slightly different (because of varying floating point arithmetic on your CPU).
python3 pca.py --max_iter=1000 --solver=lbfgs
Test set accuracy: 89.88%
python3 pca.py --max_iter=1000 --pca=1 --solver=lbfgs
Test set accuracy: 30.84%
python3 pca.py --max_iter=1000 --pca=5 --solver=lbfgs
Test set accuracy: 68.96%
python3 pca.py --max_iter=1000 --pca=10 --solver=lbfgs
Test set accuracy: 80.52%
python3 pca.py --max_iter=1000 --pca=20 --solver=lbfgs
Test set accuracy: 87.76%
python3 pca.py --max_iter=1000 --pca=50 --solver=lbfgs
Test set accuracy: 89.92%
python3 pca.py --max_iter=1000 --pca=100 --solver=lbfgs
Test set accuracy: 90.08%
python3 pca.py --max_iter=1000 --pca=200 --solver=lbfgs
Test set accuracy: 89.80%
kmeans
Deadline: Jan 7, 22:00 3 points
Using the kmeans.py template, implement the K-Means algorithm with both
- random initialization,
kmeans++initialization.
Note that your results may be slightly different (because of varying floating point arithmetic on your CPU).
python3 kmeans.py --clusters=5 --examples=150 --iterations=3 --init=random
Cluster assignments:
[4 3 4 4 3 2 3 3 4 3 4 4 4 3 1 4 3 4 1 2 3 4 3 3 1 3 3 3 3 4 0 3 3 3 4 0 3
 3 4 3 4 3 3 4 4 4 3 0 4 4 4 4 2 3 3 2 4 0 0 3 3 4 4 0 3 2 4 1 3 4 1 4 4 0
 4 3 4 1 3 0 3 4 4 3 4 1 3 4 3 3 4 4 4 3 4 4 1 4 4 3 1 3 1 4 3 3 3 4 4 4 4
 3 4 4 4 4 4 4 2 4 3 4 4 2 3 3 3 4 2 4 4 3 3 2 3 3 2 3 2 0 4 3 3 3 3 3 3 3
 3 4]
python3 kmeans.py --clusters=5 --examples=150 --iterations=3 --init=kmeans++
Cluster assignments:
[4 1 4 2 3 0 1 1 4 3 4 2 2 3 0 2 3 2 0 0 1 4 3 3 0 3 3 1 3 2 0 1 3 3 2 0 3
 3 4 1 2 3 1 2 4 2 1 0 2 4 2 2 0 1 1 0 2 0 0 1 3 4 2 0 3 0 4 0 3 2 0 4 2 0
 2 1 2 0 3 0 1 2 4 1 4 0 1 2 3 3 2 4 2 1 4 2 0 4 4 1 0 3 0 2 1 3 1 4 2 2 4
 3 2 2 4 4 2 4 0 2 1 4 4 0 3 1 3 4 0 2 4 1 1 0 3 1 0 3 0 0 4 1 1 3 3 1 1 3
 1 2]
python3 kmeans.py --clusters=7 --examples=200 --iterations=3 --init=random
Cluster assignments:
[6 0 0 3 3 1 1 1 5 4 3 6 5 2 4 4 3 3 4 3 6 3 1 3 0 6 2 0 2 6 2 1 0 3 6 3 1
 3 5 3 3 0 4 3 5 6 3 0 3 3 6 6 3 3 3 5 0 5 3 6 2 2 0 2 2 4 3 3 6 6 6 5 0 2
 1 2 2 6 2 5 0 0 1 2 5 2 2 4 5 3 6 4 6 3 3 5 1 3 3 0 5 3 0 6 2 0 2 3 5 0 3
 1 3 5 6 5 4 2 0 3 2 3 3 6 1 2 2 2 4 3 0 5 5 2 3 5 1 2 6 6 0 5 5 3 3 3 2 6
 0 0 2 0 6 3 3 2 6 0 3 5 4 1 3 5 0 3 0 5 6 3 1 5 0 0 3 0 1 3 5 4 3 3 3 2 3
 3 2 3 6 1 4 3 0 5 5 3 3 5 6 6]
python3 kmeans.py --clusters=7 --examples=200 --iterations=3 --init=kmeans++
Cluster assignments:
[4 0 0 5 5 2 2 2 2 2 5 4 2 3 2 2 6 6 2 6 4 5 2 1 0 4 3 0 3 4 3 2 0 1 4 6 2
 5 2 5 5 0 2 1 2 4 5 0 1 5 4 4 5 5 5 2 0 2 6 4 3 3 0 3 3 2 5 1 4 4 4 2 0 3
 2 3 3 4 3 2 0 0 2 3 2 3 3 2 2 5 4 2 4 5 1 2 2 5 1 0 2 1 0 4 3 0 3 1 2 0 6
 2 1 2 4 2 2 3 0 5 3 1 1 4 2 3 3 3 2 6 0 2 2 3 1 2 2 3 4 4 0 2 2 1 5 1 3 4
 0 0 3 0 4 1 5 3 4 0 1 2 2 2 6 2 0 1 0 2 4 1 2 2 0 0 5 0 2 1 2 2 1 5 1 3 1
 5 3 5 4 2 2 6 0 2 2 1 6 2 4 4]
Note that your results may be slightly different (because of varying floating point arithmetic on your CPU).
python3 kmeans.py --clusters=5 --examples=150 --iterations=5 --seed=51 --init=random
Cluster assignments:
[2 3 3 4 1 2 1 1 2 3 2 1 1 3 3 4 0 4 4 1 3 1 1 1 1 0 1 3 3 2 3 0 1 0 3 3 0
 0 1 0 1 2 1 1 3 2 1 2 2 1 3 2 2 2 3 2 1 2 1 4 3 3 4 4 2 1 1 1 1 3 1 3 1 4
 1 3 2 1 0 0 1 2 2 0 2 2 3 1 1 1 2 2 4 2 2 1 1 1 2 2 2 3 1 3 1 3 2 1 0 2 2
 3 1 1 1 3 3 0 1 3 4 1 1 4 1 3 1 4 4 3 1 4 1 4 1 1 1 3 1 1 4 2 0 3 1 4 1 2
 2 1]
python3 kmeans.py --clusters=5 --examples=150 --iterations=5 --seed=51 --init=kmeans++
Cluster assignments:
[1 3 3 4 0 1 0 2 1 3 1 2 2 3 3 4 4 4 4 2 3 2 2 2 2 4 2 3 3 0 3 4 0 4 3 3 4
 4 2 4 2 1 0 0 3 1 0 1 1 0 3 1 0 0 3 1 0 1 2 4 3 3 4 4 1 0 2 0 0 3 0 3 0 4
 2 3 1 2 4 4 2 1 1 4 1 1 3 0 2 2 1 1 4 1 1 2 0 2 1 1 1 3 0 3 2 3 1 0 4 1 1
 3 0 2 0 3 0 4 0 3 4 0 2 4 2 3 2 4 4 3 2 4 2 4 2 0 0 3 0 0 4 1 4 3 0 4 2 1
 1 2]
python3 kmeans.py --clusters=7 --examples=200 --iterations=11 --seed=67 --init=random
Cluster assignments:
[2 1 0 4 5 1 4 1 1 2 0 3 6 6 1 6 1 1 0 2 3 2 4 0 6 5 5 4 5 4 4 6 6 1 0 6 4
 4 1 6 4 5 4 4 1 0 2 1 2 2 4 3 2 1 5 2 6 0 5 6 4 2 6 3 1 1 4 5 1 2 4 5 4 5
 1 1 4 2 5 4 4 5 4 2 2 4 4 1 5 0 4 4 4 1 3 0 3 5 4 1 0 4 4 4 4 4 5 4 1 4 4
 2 5 2 6 5 2 2 4 5 4 4 3 3 2 6 1 4 1 6 1 2 3 0 5 6 4 6 4 5 5 2 0 1 6 0 1 4
 4 6 5 1 2 4 0 0 4 0 4 3 5 4 3 4 6 3 6 5 5 6 0 2 6 5 4 5 4 3 2 4 1 2 4 2 4
 2 6 4 4 6 2 4 4 6 6 5 0 2 4 1]
python3 kmeans.py --clusters=7 --examples=200 --iterations=5 --seed=67 --init=kmeans++
Cluster assignments:
[3 1 4 5 0 1 6 1 3 3 4 4 2 2 1 2 1 1 4 3 4 3 5 4 2 0 0 6 0 6 5 2 2 1 4 2 5
 5 1 2 5 0 6 6 1 4 3 1 3 3 5 4 3 1 0 3 2 4 0 2 5 3 2 4 1 1 6 0 1 3 5 0 5 0
 1 1 6 3 0 6 5 0 5 3 3 5 6 1 0 4 5 6 5 1 4 4 2 0 6 1 4 6 5 5 6 5 0 5 1 6 6
 3 0 3 2 0 3 3 5 0 6 6 4 4 3 2 1 6 1 2 1 3 4 4 0 2 6 2 6 0 0 3 4 1 2 4 1 5
 6 2 0 1 3 5 4 4 6 4 6 4 0 5 2 5 2 4 2 0 0 2 4 3 2 0 6 0 5 2 3 5 1 3 6 3 5
 3 2 6 5 2 0 6 6 2 2 0 4 3 6 1]
nli_competition
Deadline: Jan 7, 22:00 4 points+5 bonus
In this competition task you will be solving the Native Language Identification. In that task, you get an English essay writen by a non-native individual and your goal is to identify their native language.
We will be using NLI Shared Task 2013 data, which contains documents in 11 languages. For each language, the train and test sets contain 1000 and 100 documents, respectively. Particularly interesting is the fact that humans are quite bad in this task (in a simplified setting, human professionals achieve 40-50% accuracy), while machine learning models can achieve high performance.
Because the data is not publicly available, you can download it only through ReCodEx. Please do not distribute it. The template nli_competition.py can then be used to load the dataset as usual.
The performance of your system is measured using accuracy of correctly predicted documents and your goal is to achieve at least 78% accuracy. Note that you can use any sklearn algorithm to solve this exercise.
bootstrap_resampling
Deadline: Feb 15, 22:00 3 points
Given two trained models, compute their 95% confidence intervals using bootstrap resampling. Then, estimate the probability that the second one is better than the first one using a paired bootstrap test.
Start with the bootstrap_resampling.py template. Note that you usually need to perform a lot of the bootstrap resamplings, so you should make sure your implementation is fast enough.
Note that your results may be slightly different (because of varying floating point arithmetic on your CPU).
python3 bootstrap_resampling.py --seed=47 --test_size=0.9 --bootstrap_samples=1000
Confidence intervals of the two models:
- [91.41% .. 93.88%]
- [91.96% .. 94.38%]
The estimated probability that the null hypothesis holds: 2.10%
python3 bootstrap_resampling.py --seed=47 --test_size=0.9 --bootstrap_samples=10000
Confidence intervals of the two models:
- [91.35% .. 93.88%]
- [91.97% .. 94.38%]
The estimated probability that the null hypothesis holds: 2.40%
python3 bootstrap_resampling.py --seed=47 --test_size=0.9 --bootstrap_samples=100000
Confidence intervals of the two models:
- [91.35% .. 93.88%]
- [91.97% .. 94.38%]
The estimated probability that the null hypothesis holds: 2.21%
python3 bootstrap_resampling.py --seed=55 --test_size=0.95 --bootstrap_samples=50000
Confidence intervals of the two models:
- [84.72% .. 88.00%]
- [85.30% .. 88.52%]
The estimated probability that the null hypothesis holds: 5.47%
permutation_test
Deadline: Feb 15, 22:00 2 point
Given two trained models, perform a random permutation test that the second one is better than the first one.
Start with the permutation_test.py template. Note that you usually need to perform a lot of resamplings, so you should make sure your implementation is fast enough.
Note that your results may be slightly different (because of varying floating point arithmetic on your CPU).
python3 permutation_test.py --seed=47 --test_size=0.9 --random_samples=1000
The estimated p-value of the random permutation test: 3.10%
python3 permutation_test.py --seed=47 --test_size=0.9 --random_samples=10000
The estimated p-value of the random permutation test: 2.99%
python3 permutation_test.py --seed=47 --test_size=0.9 --random_samples=100000
The estimated p-value of the random permutation test: 3.11%
python3 permutation_test.py --seed=55 --test_size=0.95 --random_samples=50000
The estimated p-value of the random permutation test: 6.55%
In the competitions, your goal is to train a model and then predict target values on the test set available only in ReCodEx.
Submitting to ReCodEx
When submitting a competition solution to ReCodEx, you should submit a trained model and a Python source capable of running it.
Furthermore, please also include the Python source and hyperparameters
you used to train the submitted model. But be careful that there still must be
exactly one Python source with a line starting with def main(.
Do not forget about the maximum allowed model size and time and memory limits.
Competition Evaluation
-
Before the deadline, ReCodEx prints the exact achieved score, but only if it is worse than the baseline.
If you surpass the baseline, the assignment is marked as solved in ReCodEx and you immediately get regular points for the assignment. However, ReCodEx does not print the reached score.
-
After the competition deadline, the latest submission of every user surpassing the required baseline participates in a competition. Additional bonus points are then awarded according to the ordering of the performance of the participating submissions.
-
After the competition results announcement, ReCodEx starts to show the exact performance for all the already submitted solutions and also for the solutions submitted later.
-
Each competition will be scored after the first deadline.
-
The bonus points will be computed in the following fashion:
-
Let be the maximal number of bonus points that can be achieved in the competition.
-
All of the solutions that surpass the baseline will be sorted and divided into groups of equal size.
-
Every solution in the top group gets B points, the next group gets points, etc., the last group gets 0 bonus points.
-
The team solution only occupies one position in the table of the competition results.
-
-
Please, do not forget that every member of the team needs to upload the solution to ReCodEx and to submit both the training/prediction source code and the trained model itself.
Repeated Participation in Competitions
- If a participant got non-zero points for a competition task already in
previous years, they are treated slightly differently. Namely, every team
with one or more returning participants still get competition points, but
- the returning team results are not shown on the slides on the practicals;
- the returning team results are shown in italics in ReCodEx;
- the returning team results are not used to compute the thresholds for competition points.
What Is Allowed
- You can use only the given annotated data, both for training and evaluation.
- Additionally, you can use any unannotated or manually created data for training and evaluation.
- The test set annotations must be the result of your system (so you cannot manually correct them; but your system can contain other parts than just trained models, like hand-written rules).
- Do not use test set annotations in any way, if you somehow get access to them.
- You can use any method present in
numpyorscipy, anything you implement yourself, and, unless specified otherwise in assignment description, any method fromsklearn. Furthermore, the solution must be created by you, and you must understand it fully. Do not use deep network frameworks like TensorFlow or PyTorch.
Install
-
Installing to central user packages repository
You can install all required packages to central user packages repository using
pip3 install --user scikit-learn==1.7.2 numpy==2.3.3 scipy==1.16.2 pandas==2.3.2 matplotlib==3.10.6. -
Installing to a virtual environment
Python supports virtual environments, which are directories containing independent sets of installed packages. You can create a virtual environment by running
python3 -m venv VENV_DIRfollowed byVENV_DIR/bin/pip3 install scikit-learn==1.7.2 numpy==2.3.3 scipy==1.16.2 pandas==2.3.2 matplotlib==3.10.6(orVENV_DIR/Scripts/pip3on Windows). -
Windows installation
- On Windows, it can happen that
python3is not in PATH, whilepycommand is; in that case you can usepy -m venv VENV_DIR, which uses the newest Python available, or for examplepy -3.11 -m venv VENV_DIR, which uses Python version 3.11.
- On Windows, it can happen that
Git
-
Is it possible to keep the solutions in a Git repository?
Definitely. Keeping the solutions in a branch of your repository, where you merge them with the course repository, is probably a good idea. However, please keep the cloned repository with your solutions private.
-
On GitHub, do not create a public fork containing your solutions.
If you keep your solutions in a GitHub repository, please do not create a clone of the repository by using the Fork button; this way, the cloned repository would be public.
- If you created a public fork and want to make it private, you need to start by pressing Leave fork network in the repository settings; only then you can change the visibility to private.
Of course, if you want to create a pull request, GitHub requires a public fork and you need to create it, just do not store your solutions in it (so you might end up with two repositories, a public fork for pull requests and a private repo for your own solutions).
-
How to clone the course repository?
To clone the course repository, run
git clone https://github.com/ufal/npfl129This creates the repository in the
npfl129subdirectory; if you want a different name, add it as an additional parameter.To update the repository, run
git pullinside the repository directory. -
How to merge the course repository updates into a private repository with additional changes?
It is possible to have a private repository that combines your solutions and the updates from the course repository. To do that, start by cloning your empty private repository, and then run the following commands in it:
git remote add course_repo https://github.com/ufal/npfl129
git fetch course_repo
git checkout --no-track course_repo/master
This creates a new remote
course_repoand a clone of themasterbranch from it; however,git pullandgit pushin this branch will operate on the repository your cloned originally.To update your branch with the changes from the course repository, run
git fetch course_repo
git merge course_repo/master
while in your branch (the command
git pull --no-rebase course_repo masterhas the same effect). Of course, it might be necessary to resolve conflicts if both you and the course repository modified the same lines in the same files.
ReCodEx
-
What files can be submitted to ReCodEx?
You can submit multiple files of any type to ReCodEx. There is a limit of 20 files per submission, with a total size of 20MB.
-
What file does ReCodEx execute and what arguments does it use?
Exactly one file with
pysuffix must contain a line starting withdef main(. Such a file is imported by ReCodEx and themainmethod is executed (during the import,__name__ == "__recodex__").The file must also export an argument parser called
parser. ReCodEx uses its arguments and default values, but it overwrites some of the arguments depending on the test being executed; the template always indicates which arguments are set by ReCodEx and which are left intact. -
What are the time and memory limits?
The memory limit during evaluation is 1.5GB. The time limit varies, but it should be at least 10 seconds and at least twice the running time of my solution. For competition assignments, the time limit is 5 minutes.
Requirements
To pass the practicals, you need to obtain at least 70 points, excluding the bonus points. Note that up to 40 points above 70 (both bonus and non-bonus) will be transfered to the exam. In total, assignments for at least 105 points (not including the bonus points) will be available.
To pass the exam, you need to obtain at least 60, 75, or 90 points out of 100-point exam to receive a grade 3, 2, or 1, respectively. The exam consists of 100-point-worth questions from the list below (the questions are randomly generated, but in such a way that there is at least one question from every pair of lectures). In addition, you can get at most 40 surplus points from the practicals and at most 10 points for community work (i.e., fixing slides or reporting issues) – but only the points you already have at the time of the exam count. You can take the exam without passing the practicals first.
Exam Questions
Lecture 1 Questions
-
Explain how reinforcement learning differs from supervised and unsupervised learning in terms of the type of input the learning algorithms use to improve model performance. [5]
-
Explain why we need separate training and test data. What is generalization, and how does the concept relate to underfitting and overfitting? [10]
-
Define the three key components of Mitchell's definition of machine learning (Task , Performance measure , and Experience ). Give a concrete example for each component in the context of email spam classification. [10]
-
Explain the difference between classification and regression tasks. For each task type, provide: (a) the mathematical representation of the target variable, (b) a real-world example, and (c) one appropriate evaluation metric. [10]
-
Define the prediction function of a linear regression model and write down -regularized mean squared error loss. [10]
-
Starting from the unregularized sum of squares error of a linear regression model, show how the explicit solution can be obtained, assuming is invertible. [10]
Lecture 2 Questions
-
Describe standard gradient descent and compare it to stochastic (i.e., online) gradient descent and minibatch stochastic gradient descent. Explain what it is used for in machine learning. [10]
-
Explain the relationship between model capacity and overfitting/underfitting. How does increasing polynomial degree in linear regression affect model capacity, and what are the consequences? [10]
-
Explain possible intuitions behind regularization. [5]
-
Explain the difference between hyperparameters and parameters. [5]
-
Write an -regularized minibatch SGD algorithm for training a linear regression model, including the explicit formulas (i.e, formulas you would need to code it with
numpy) of the loss function and its gradient. [10] -
Does the SGD algorithm for linear regression always find the best solution on the training data? If yes, explain under what conditions it happens; if not, explain why it is not guaranteed to converge. What properties of the error function does this depend on? [10]
-
After training a model with SGD, you ended up with a low training error and a high test error. Using the learning curves, explain what might have happened and what steps you might take to prevent this from happening. [10]
-
You were given a fixed training set and a fixed test set, and you are supposed to report model performance on that test set. You need to decide what hyperparameters to use. How will you proceed and why? [10]
-
What methods can be used to normalize feature values? Explain why it is useful. [5]
-
You have a dataset with a categorical feature “color” with values {“red”, “green”, “blue”}. Explain why using integer encoding (
red=0,green=1,blue=2) is problematic for linear regression. How would encode such feature instead? [10]
Lecture 3 Questions
-
Define binary classification, write down the perceptron algorithm, and show how a prediction is made for a given data instance . [10]
-
Explain what it means for a dataset to be linearly separable. Give an example of a simple 2D dataset that is not linearly separable and explain why the perceptron algorithm would fail on it. [10]
-
For discrete random variables, define entropy, cross-entropy, and Kullback-Leibler divergence, and prove the Gibbs inequality (i.e., that KL divergence is non-negative). [20]
-
Explain the notion of likelihood in machine learning. What likelihood are we estimating, and why do we do it? [10]
-
Describe maximum likelihood estimation as minimizing NLL, cross-entropy, and KL divergence and explain whether they differ or are the same and why. [20]
-
Provide an intuitive justification for why cross-entropy is a good optimization objective in machine learning. What distributions do we compare in cross-entropy? Why is it good when the cross-entropy is low? [5]
-
Considering the binary logistic regression model, write down its parameters (including their size) and explain how we decide what classes the input data belong to (including the explicit formula for the sigmoid function). [10]
-
Write down an -regularized minibatch SGD algorithm for training a binary logistic regression model, including the explicit formulas (i.e., formulas you would need to code it in
numpy) of the loss function and its gradient (saying just is not enough). [20] -
Compare and contrast perceptron and logistic regression by discussing: (a) what each algorithm optimizes, (b) whether each provides probability estimates, (c) whether each is guaranteed to converge, and (d) the quality of solutions each finds. [10]
-
Explain in intuitive terms why we use the logarithm when working with likelihoods in machine learning. What are the computational and optimization advantages of using negative log-likelihood instead of directly maximizing the likelihood? [5]
Lecture 4 Questions
-
Define mean squared error and show how it can be derived using MLE. What assumptions do we make during such derivation? [10]
-
Considering -class logistic regression model, write down its parameters (including their size) and explain how we decide what classes the input data belong to (including the formula for the softmax function). [10]
-
Explain the relationship between the sigmoid function and softmax. [5]
-
Show that the softmax function is invariant towards constant shift. [5]
-
Write down an -regularized minibatch SGD algorithm for training a -class logistic regression model, including the explicit formulas (i.e., formulas you would use to code it in
numpy) of the loss function and its gradient. [20] -
Prove that decision regions of a multiclass logistic regression are convex. [10]
-
Considering a single-layer MLP with input neurons, hidden neurons, output neurons, hidden activation , and output activation , list its parameters (including their size) and write down how the output is computed. [10]
-
List the definitions of frequently used MLP output layer activations (the ones producing parameters of a Bernoulli distribution and a categorical distribution). Then, write down three commonly used hidden layer activations (sigmoid, tanh, ReLU). Explain why identity is not a suitable activation for hidden layers. [10]
-
Explain the role of initialization in training MLPs. Why is it problematic to initialize all weights to zero? What is a common strategy for random initialization, and why does it typically scale with the input dimension? [10]
-
You have trained two models on the same dataset: (1) logistic regression and (2) a multilayer perceptron with one hidden layer of 100 neurons. The MLP achieves 95% training accuracy while logistic regression achieves 85%. However, both achieve 84% test accuracy. Interpret these results and explain what they suggest about the models and the data. [5]
-
You are supposed to train an MLP for regression that has several numeric features as the input. How would you preprocess them? Specifically, would you use polynomial features? Explain your decision. [5]
Lecture 5 Questions
-
Considering a single-layer MLP with input neurons, a ReLU hidden layer with units, and a softmax output layer with units, write down the explicit formulas (i.e., formulas you would use to code it in
numpy) for the forward pass through the MLP. [10] -
Compute the partial derivative of with respect to . Explain how this computation is used when training MLP. [20]
-
Formulate the computation of MLP as a computation graph. What do the nodes and the edges of the graph represent? Explain how such a graph can be used to compute the gradients of the parameters in the back-propagation algorithm. [10]
-
Explain the concept of dropout as a regularization technique for MLPs. How does it work during training versus at test time, and what is the intuition behind why it improves generalization? [10]
-
Formulate the Universal approximation theorem and explain in words what it says about multi-layer perceptron. [10]
-
How do we search for a minimum of a function subject to equality constraints ? [10]
-
Prove which categorical distribution with classes has maximum entropy. [10]
-
Consider derivation of softmax using maximum entropy principle, assuming we have a dataset of examples . Formulate the three conditions we impose on the searched , and write down the Lagrangian to be minimized. Explain in words what is the interpretation of the conditions. [20]
-
Define precision (including true positives and others), recall, score, and score (we stated several formulations for and scores; any one of them will do). [10]
-
Explain the difference between micro-averaged and macro-averaged scores. Under what circumstances do we use them? [10]
-
Explain (using examples) why accuracy is not a suitable metric for unbalanced target classes, e.g., for a diagnostic test for a contagious disease. [5]
Lecture 6 Questions
-
Explain how the TF-IDF weight of a given document-term pair is computed. [5]
-
What is Zipf's law? Explain how it can be used to provide intuitive justification for using the logarithm when computing IDF. [5]
-
Define conditional entropy and mutual information, write down the relation between them, and finally prove that mutual information is zero if and only if the two random variables are independent (you do not need to prove statements about ). [10]
-
Show that TF-IDF terms can be considered portions of suitable mutual information. [10]
-
Explain the concept of word embedding in the context of MLP and how it relates to representation learning. [5]
-
Describe the skip-gram model trained using negative sampling. What is it used for? What are the input and output of the algorithm? Use an equation to describe the loss function. [10]
-
Explain why the skip-gram model uses negative sampling instead of softmax. [5]
-
How would you train a part-of-speech tagger (i.e., you want to assign each word to its part of speech) if you could only use labeled data, pre-trained word embeddings and MLP classifier? [5]
Lecture 7 Questions
-
Describe the prediction of nearest neighbors, both for regression and classification. Define norm and describe uniform, inverse, and softmax weighting. [10]
-
Show that -regularization can be obtained from a suitable prior by Bayesian inference (from the MAP estimate). [10]
-
Write down how is approximated in a Naive Bayes classifier, explicitly state the Naive Bayes assumption, and show how the prediction is performed. [10]
-
Considering a Gaussian Naive Bayes, describe how probabilities are modeled (what distribution and which parameters it has) and how we estimate it during fitting. [10]
-
Considering a Bernoulli Naive Bayes, describe how probabilities are modeled (what distribution and which parameters it has) and how we estimate it during fitting. [10]
-
What measures can we take to prevent numeric instabilities in the Naive Bayes classifier, particularly if the probability density is too high in Gaussian Naive Bayes and there are zero probabilities in Bernoulli Naive Bayes? [10]
-
What is the difference between discriminative and (classical) generative models? [5]
Lecture 8 Questions
-
Prove that independent discrete random variables are uncorrelated. [10]
-
Give an example of two random variables that are dependent but uncorrelated. [5]
-
Write down the definition of covariance and Pearson correlation coefficient , including its range. [10]
-
Explain how Spearman's rank correlation coefficient and Kendall's rank correlation coefficient are computed (there is no need to describe the Pearson correlation coefficient). [10]
-
Describe setups or tasks where a correlation coefficient might be a good model evaluation metric. [5]
-
Describe under what circumstance correlation can be used to assess the validity of evaluation metrics. Name examples of tasks. What data do you need besides the model predictions and the targets? [10]
-
Define Mean Reciprocal Rank (MRR) and explain for what tasks it is used. Describe a scenario where you would prefer MRR over Spearman/Kendall correlation. [10]
-
Define Cohen's (including the definition of the respective probabilities) and explain what it is used for when collecting data for machine learning. [10]
-
Explain the relationship between inter-annotator agreement and expected model performance. Why is it suspicious if a model achieves performance significantly above the inter-annotator agreement? What does this suggest about the model and the data? [10]
Lecture 9 Questions
-
Considering an averaging ensemble of models, prove the relation between the average mean squared error of the ensemble and the average error of the individual models, assuming the model errors have zero means and are uncorrelated. Use a formula to explain what uncorrelated errors mean in this context. [20]
-
Explain knowledge distillation: what it is used for, describe how it is done. What is the loss function? How does it differ from standard training? [10]
-
Describe the difference between voting (hard voting) and averaging (soft voting) in classification ensembles. Assuming, you have classication into three classes, give an example of classifier outputs where hard voting and soft voting differ. [10]
-
List and explain three common heuristics used to control the growth of decision trees. Explain what problem it helps prevent and why. [10]
-
In a regression decision tree, state what values are kept in internal nodes, define the squared error criterion, and describe how a leaf is split during training (without discussing splitting constraints). [10]
-
Explain the CART algorithm for constructing a decision tree. Explain the relationship between the loss function that is optimized during the decision tree construction and the splitting criterion that is during the node splitting. [10]
-
In a binary classification decision tree, state what values are kept in internal nodes, define the Gini index, and describe how a node is split during training (without discussing splitting constraints). [10]
-
In a -class classification decision tree, state what values are kept in internal nodes, define the entropy criterion, and describe how a node is split during training (without discussing splitting constraints). [10]
-
For binary classification using decision trees, derive the Gini index from a squared error loss. [20]
-
For -class classification using decision trees, derive the entropy criterion from a non-averaged NLL loss. [20]
-
Describe how a random forest is trained (including bagging and a random subset of features) and how prediction is performed for regression and classification. [10]
Lecture 10 Questions
-
Explain the main differences between random forests and gradient-boosted decision trees. [5]
-
Explain the intuition for second-order optimization using Newton's root-finding method or Taylor expansions. [10]
-
Write down the loss function that we optimize in gradient-boosted decision trees while constructing tree. Then, define and and show the value of optimal prediction in node and the criterion used during node splitting. Explain how the loss formulation relates to Taylor's expansions. [20]
-
List and explain three common techniques used in gradient boosting (beyond the basic algorithm) for preventing overfitting. [10]
-
For binary classification with gradient boosted decision trees, write down how the prediction is computed and define the per-example loss function. [10]
-
For a -class classification, describe how to perform prediction with a gradient boosted decision tree trained for time steps (how the individual trees perform prediction and how are the trees combined to produce the predicted categorical distribution). [10]
-
What type of data are gradient boosted decision trees suitable for as opposed to multilayer perceptron? Explain the intuition why it is the case. [5]
Lecture 11 Questions
-
Formulate SVD decomposition of matrix , describe properties of individual parts of the decomposition. Explain what the reduced version of SVD is. [10]
-
Formulate the Eckart-Young theorem. Provide an interpretation of what the theorem says and why it is useful. [10]
-
Given a data matrix , explain how to compute the PCA of dimension M using the SVD decomposition. [10]
-
Describe how SVD can be used in recommender systems. What are the advantages of using SVD instead of the full user-interaction matrix? [10]
-
Given a data matrix , write down the algorithm for computing the PCA of dimension using the power iteration algorithm. [20]
-
List at least two applications of SVD or PCA. [5]
-
Describe the -means algorithm, including the
kmeans++initialization. What is it used for? What is the loss function that the algorithm optimizes? What can you say about the algorithm convergence? [20] -
Name at least two clustering algorithms. What is their main principle? How do they differ? [10]
Lecture 12 Questions
-
Considering statistical hypothesis testing, define type I errors and type II errors (in terms of the null hypothesis). Finally, define what a significance level is. [10]
-
Explain what a test statistic and a p-value are. [5]
-
Write down the steps of a statistical hypothesis test, including a definition of a p-value. [10]
-
Explain the differences between a one-sample test, a two-sample test, and a paired test. [10]
-
When considering the multiple comparison problem, define the family-wise error rate and prove the Bonferroni correction, which allows limiting the family-wise error rate by a given . [10]
-
For a trained model and a given test set with examples and metric , write how to estimate 95% confidence intervals using bootstrap resampling. [10]
-
For two trained models and a given test set with examples and metric , explain how to perform a paired bootstrap test that the first model is better than the other. [10]
-
For two trained models and a given test set with examples and metric , explain how to perform a random permutation test that the first model is better than the other with a significance level . What is the null hypothesis here? How do to compute the -value? [10]
-
Explain why the paired bootstrap test does not produce a true p-value, even though it can be useful for model comparison. What is the fundamental difference between the distribution obtained through bootstrap resampling and the distribution required for proper hypothesis testing? [10]
Lecture 13 Questions
-
Explain the difference between deontological and utilitarian ethics. List examples of how these theoretical frameworks can be applied in machine learning ethics. [10]
-
List at least two potential ethical problems related to data collection. [5]
-
List at least two potential ethical problems that can originate in model evaluation. [5]
-
List at least one example of an ethical problem that can originate in model design or model development. [5]
-
Under what circumstances could train-test mismatch be an ethical problem? [5]
-
Chose one ethical issue with deploying ML systems and describe it from deontological and utalitarian perspective. [5]
