600.465 Introduction to NLP (Fall 1999)
EXAMPLE
OF AN ACCEPTABLE Assignment #1
Exploring Entropy and Language Modeling
Some technical hints:
You might consider e.g. xv (or any other imaging software) to capture the graphs plotted by the Shannon.tcl program while playing, and store them as a Netscape-renderable image file, such as .gif or .jpg. Postscript images (see the one at the end) are fine too as long as they are acceptable for gv (Ghostview - test it!). The Postcript image here has been obtained by the gnuplot program, using a definition file, and a human entropies file and a computer entropies file. Anything fancier would work too, but however the presentation is importatn, please concentrate on contents of the problem, especially in the subsequent assignments
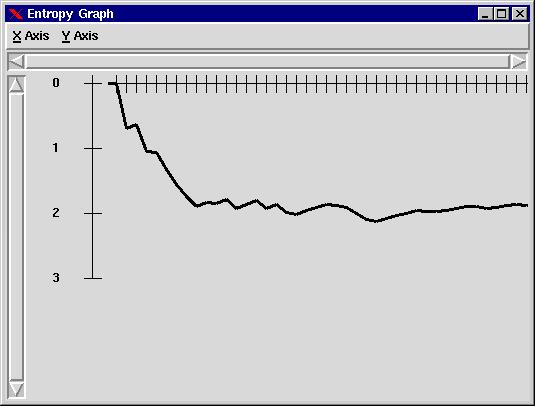
The Shannon game
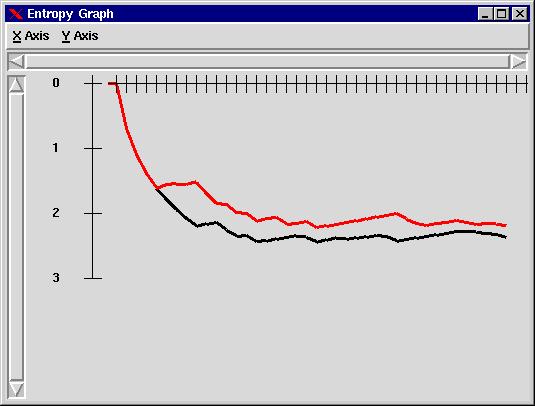
(Book selected: darwin_descOMan.tok)History = 2, 40 turns, H(Me) = 2.21, H(Computer) = 2.05
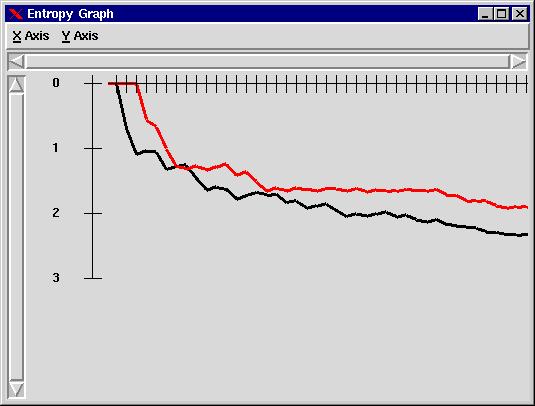
History = 3, 40 turns, H(Me) = 2.35, H(Computer) = 1.88
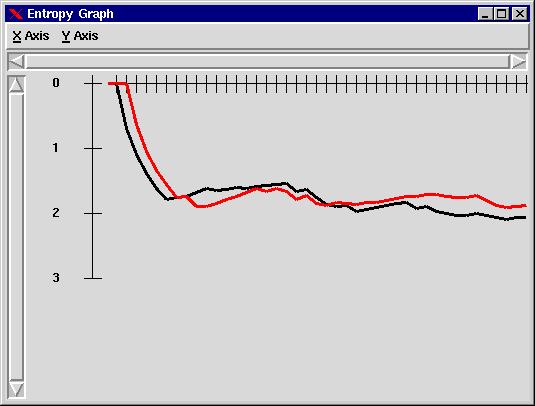
History = 4, 40 turns, H(Me) = 2.05, H(Computer) = 1.87
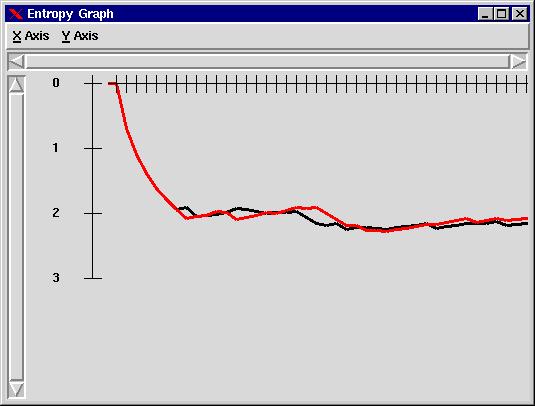
History = 5, 40 turns, H(Me) = 2.22, H(Computer) = 2.20
History = 20, 60 turns, H(Me) = 1.62
Final results - Summary:
| History Length | Human | Computer |
|---|---|---|
| 2 | 2.21 | 2.05 |
| 3 | 2.35 | 1.88 |
| 4 | 2.05 | 1.87 |
| 5 | 2.22 | 2.20 |
| 20 | 1.62 | --- |
Discussion
As a non-native speaker of English, I am not sure how much are the above results relevant for measuring the human vs. computer performance. Subjectively, it was much easier to guess the letters when more context was available, but even at 20 letters one is lost completely at times.The decline of computer results at five-letter long history could be rooted in the small data size used in this experiment causing the data sparsenes problem.
At the history length of 20, the computer will do great/poorly because...
Etc. Please include every reasonable thought you might have on this matter.